Inexact drawing of points

Hallo,

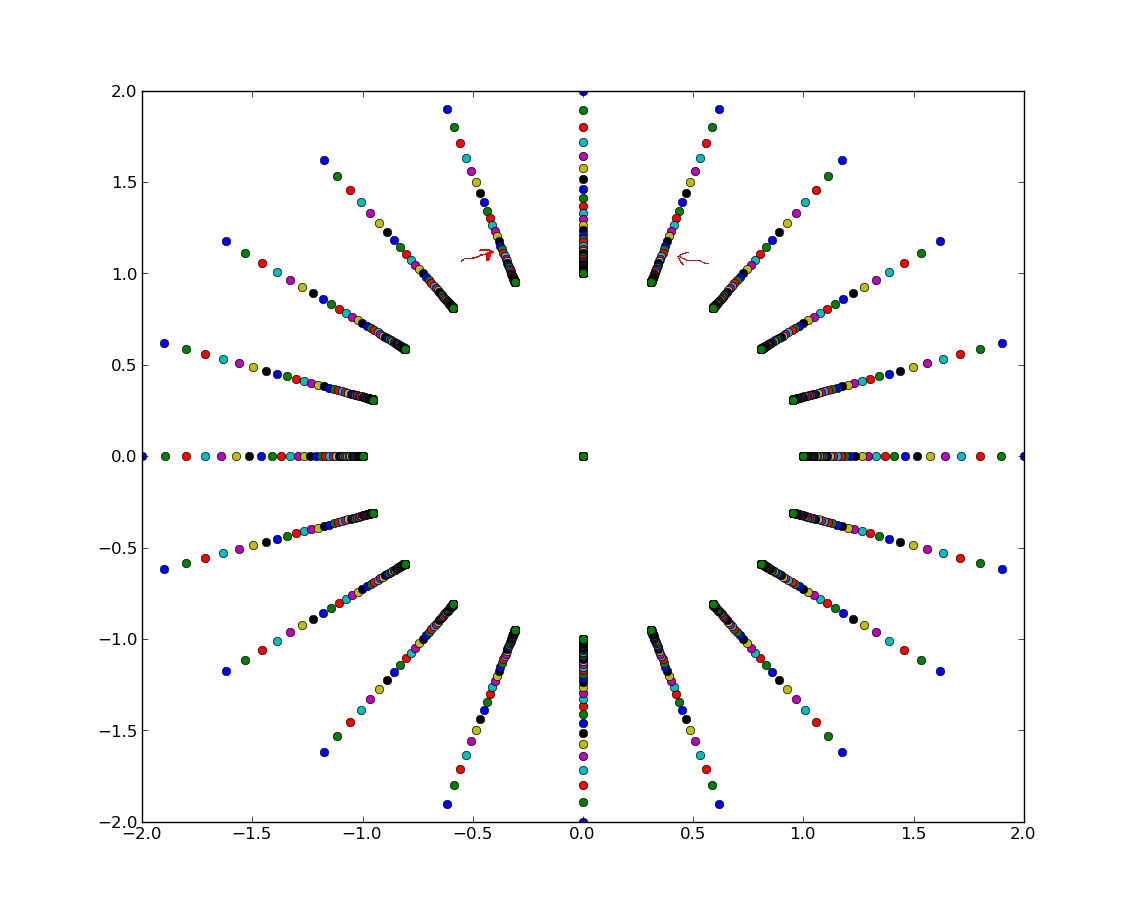
i am observing inexact drawing of point in matplotlib. To demonstrate the effect, two plot are appended, where the some examples of inexact drawing are marked. The file “image.jpeg” shows the effect most drastically. The points in this plot should lie on straight lines pointing towards the center. However there are small deviations.

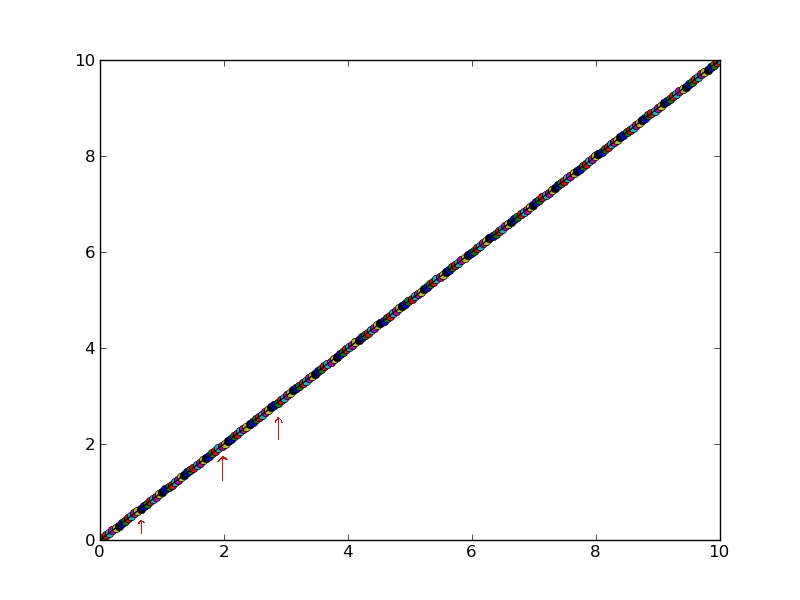
To illustrate this with a simple example, i generated the plot “simple_example.jpeg” with the following commands:

t = linspace(0,10,200)

for i in range(200):

plot(t[i],t[i],“o”)

plot(t,t,“k”)

There, too, some examples are marked. The deviations are rather small, but still noticeable.

Is this kind of behavior known? Can i fix this somehow? Is this a bug?

This was tested with versions 0.99.3 and 1.1 on debian 6.0

With best regards

Anton Daitche

image.jpeg

simple_example.jpeg

2011/11/2 Anton Daitche <a.daitche@...982...>:

Hallo,
i am observing inexact drawing of point in matplotlib.

As I remember from an earlier discussion on this, it's assumed that
these small deviations are tolerable in the agg renderer. This makes
the interactive backends more responsive at expenses of accuracy.

I can see the same deviations using the tkagg backend with mpl 1.1.0
but if I save as pdf using the save button I get an accurate rendering
(see attachment).

Best regards

Goyo

simple_example.pdf (8.48 KB)

Hi,

As I remember from an earlier discussion on this, it’s assumed that

these small deviations are tolerable in the agg renderer. This makes

the interactive backends more responsive at expenses of accuracy.

Do you remember the name of the thread? I would like to understand the details on this.

I also would like to find out if i can force the renderer to do exact drawing (at some computational cost).

I can see the same deviations using the tkagg backend with mpl 1.1.0

but if I save as pdf using the save button I get an accurate rendering

(see attachment).

I can verify this. Thanks for pointing this out.

With best regards

Anton

For speed in the Agg backend the markers are drawn once and then
copied as rasters to all of their positions. This implies that the
markers end up pixel aligned, which is the source of the error
you’re seeing. This does not happen in the vector backends.

If you want to not get this behavior, you can use scatter() instead

of plot().

Mike
···

http://p.sf.net/sfu/rsa-sfdev2dev1Matplotlib-users@lists.sourceforge.nethttps://lists.sourceforge.net/lists/listinfo/matplotlib-users

2011/11/7 Anton Daitche <a.daitche@...982...>:

Do you remember the name of the thread? I would like to understand the
details on this.

I can't find it right now but I guess Michael's answer helps you.

I also would like to find out if i can force the renderer to do exact
drawing (at some computational cost).

Do you mean using an interactive backend? You can try gtkcairo and wx.
I think they have their own issues though.

Goyo

Or, as I suggested, use scatter() instead of plot().

Mike

···

On 11/13/2011 10:03 AM, Goyo wrote:

2011/11/7 Anton Daitche<a.daitche@...982...>:

Do you remember the name of the thread? I would like to understand the
details on this.

I can't find it right now but I guess Michael's answer helps you.

I also would like to find out if i can force the renderer to do exact
drawing (at some computational cost).

Do you mean using an interactive backend? You can try gtkcairo and wx.
I think they have their own issues though.