Currently, I am trying to plot a 2D array with imshow and two 1D arrays on separate plots attached to the top and right of the imshow image. I got it to work, however when I change the aspect of the image (which I want to do) white space and unusual scalings appear. I want to get rid of it and have the scales that match the aspect.
Basically, I want to do the same thing shown in the example http://matplotlib.sourceforge.net/examples/axes_grid/scatter_hist.html
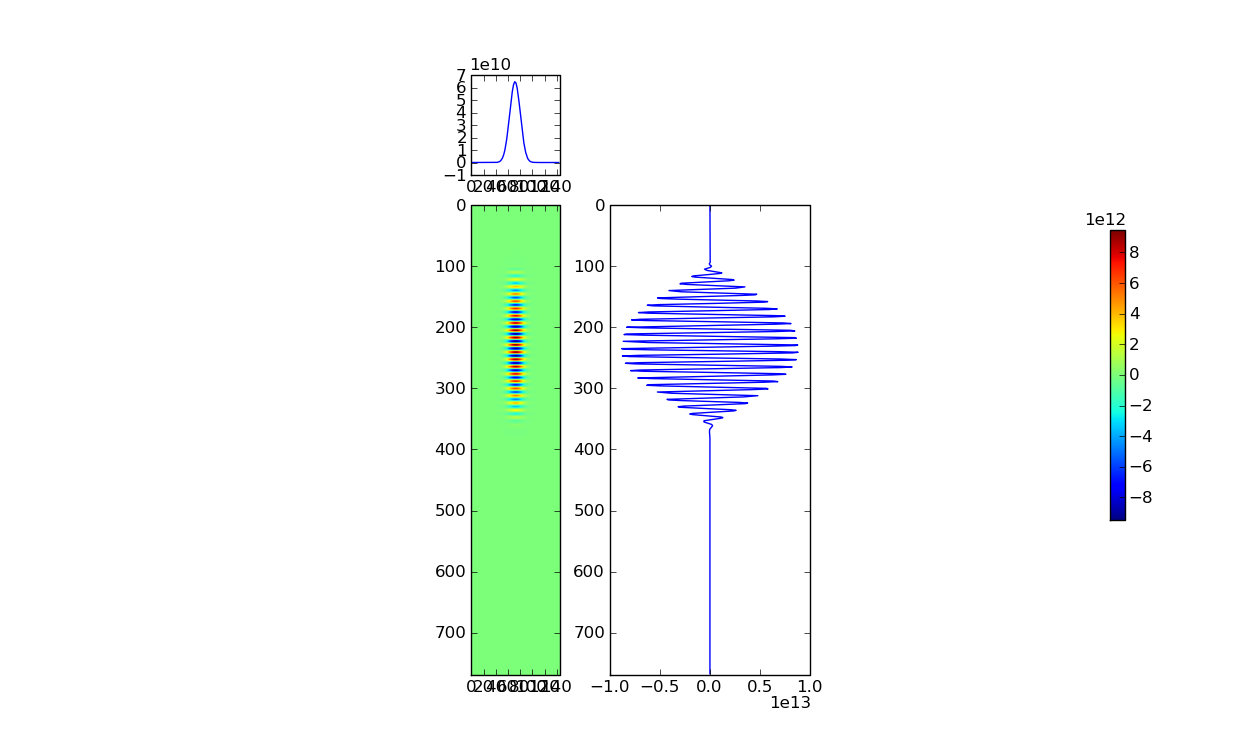
attached is the result with out the aspect change.
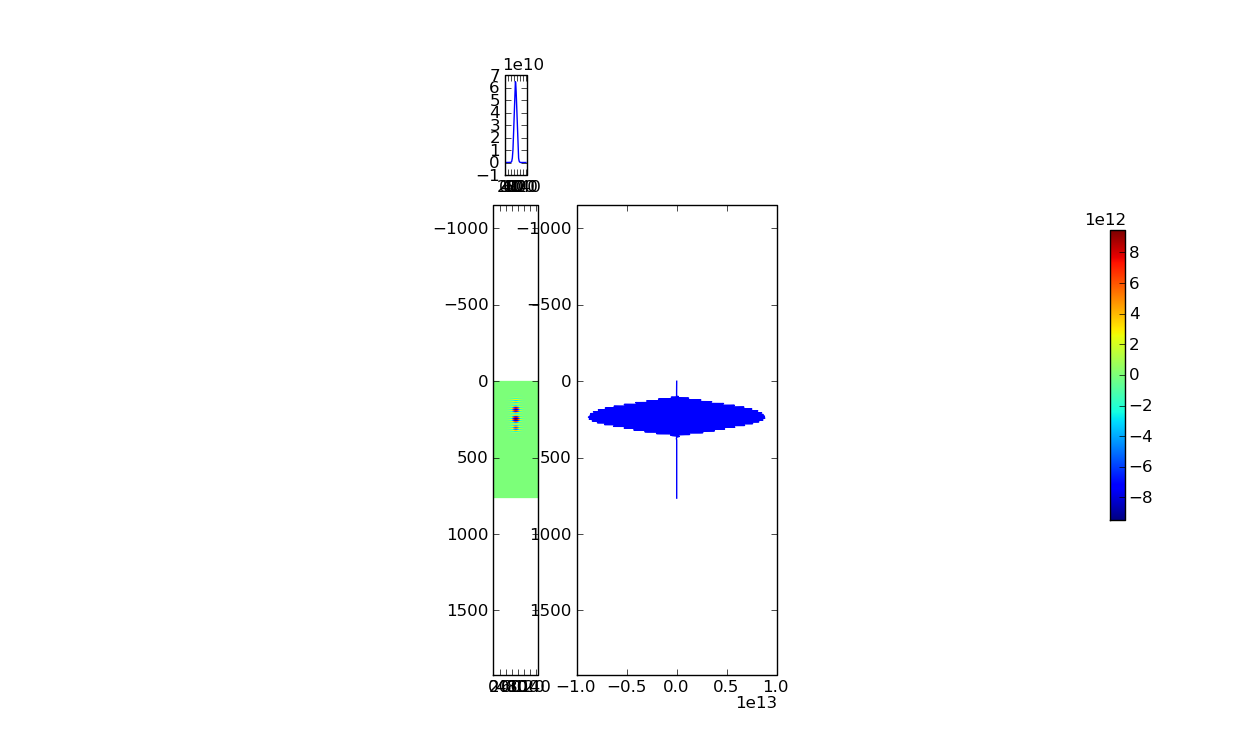
also attached is the result with aspect change attempt.
here is the code that produces the result above:
import numpy as np
import tables
from matplotlib.pyplot import *
import matplotlib as mpl
import matplotlib.cm as cm
fig = figure(figsize=[12.5,7.5])
from mpl_toolkits.axes_grid import make_axes_locatable
#get 3D array from hdf5 file
a = tables.openFile(“/Users/magoo/vorpal-data-2/unl-1mm-3d_ElecMultiField_25.h5”)
b = a.root.ElecMultiField[ : , : , : ,1]
ax = fig.add_subplot(111)
ax.set_autoscale_on(False)
divider = make_axes_locatable(ax)
axLOutx = divider.new_vertical(1, pad=0.3, sharex=ax)
fig.add_axes(axLOutx)
#plot line above
axLOutx.plot(b[365,:,75])
axLOutx.set_xlim( (0,145))
axLOuty = divider.new_horizontal(2, pad=0.5, sharey=ax)
fig.add_axes(axLOuty)
#plot line on right
yarr = np.arange(0, np.shape(b[:, 75, 75])[0], 1)
axLOuty.plot(b[:,75,75], yarr)
axLOuty.set_ylim( (769,0))
plot image/2D array
im = ax.imshow(b[:,:,75], extent=[0,145,769,0],cmap=cm.jet) # when I add (aspect = .5) as another argument I get what is shown in the second attached image
cb = colorbar(im, fraction=0.015)
plt.draw()
plt.show()