Hello
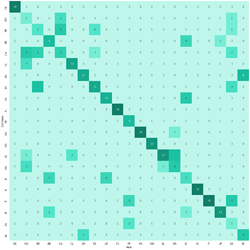
I want to display the xsticklabels and ysticklabels as small images in place of labels in a graphic.
- As I use Jupyter Notebook, I have to insert it before everything:
%matplotlib inline
- Then I add some imports:
# For figure, subplot, and for stats, heatmap
import matplotlib, seaborn
import matplotlib.image as mpimg
import matplotlib.pyplot as plt
# For heatmap
import seaborn as sns; sns.set();
from sklearn.metrics import confusion_matrix
from sklearn.metrics import classification_report
from sklearn.metrics import accuracy_score
- I added the figure and created an empty axis before everything:
plt.figure(figsize = (25, 25))
ax = plt.subplot()
- I searched, added and showed the images:
img1 = mpimg.imread('../images/flag-brazil.png')
img2 = mpimg.imread('../images/flag-canada.png')
img3 = mpimg.imread('../images/flag-china.png')
img4 = mpimg.imread('../images/flag-germany.png')
imgplot1 = mpimg.imshow(img1)
imgplot2 = mpimg.imshow(img2)
imgplot3 = mpimg.imshow(img3)
imgplot4 = mpimg.imshow(img4)
- I created a new labels array for both
xsticklabelsandysticklabels, catching the variablesimgplot1,imgplot2and others:
country_flags = [imgplot1, imgplot2, imgplot3, imgplot4]
- I created a matrix:
mat = confusion_matrix(train_y, train_est_y)
Observe that the variables train_y and train_est_y are extracted from a dataset in another Python code that I do not need to include here.
- Now I created a
heatmap, and reaplcedxsticklabels = labelsandysticklabels = labelswithxsticklabels = country_flagsandysticklabels = country_flags:
sns.heatmap(mat.T, square = True, annot = True, annot_kws = {"fontfamily": 'TH Sarabun New', "fontsize": 16}, fmt = 'd', cbar = False, cmap = cm, xticklabels = country_flags, yticklabels = country_flags)
- Finally, nothing important:
plt.xlabel('Real', fontproperties = font_prop)
plt.ylabel('Estimado', fontproperties = font_prop)

print(classification_report(train_y, train_est_y))
print('A acurácia é ', accuracy_score(train_est_y, train_y))
For example, I will use the original country_flags = ["DE", "AO", "AR", "BR", "CA", "CL", "ZH", "ES", "US", "FJ", "FR", "KA", "GN", "EL", "HA", "ID", "IS", "IT", "JP", "ZA", "IN"]:
