How to remove the white space arround the generated graph?

Hi all, First of all, thank you for this awesome library,

    > you mad my life heck of a lot easier - no really :slight_smile:

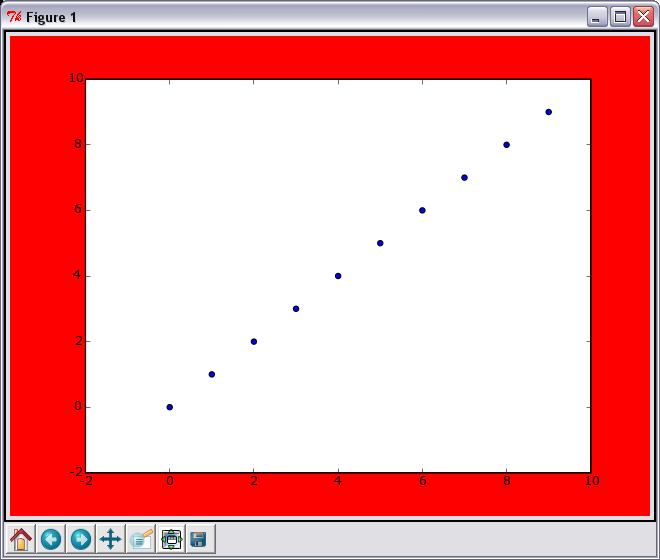
    > I'm interested into how to remove the whitespace which is
    > around the figure? You can really see it when you export
    > your picture via savefig()

    > Example graph:
    > http://svn.petarmaric.com/playground/trunk/test.png Script
    > source:
    > http://svn.petarmaric.com/playground/trunk/web_graph/views.py

    > I guess this is probably a pretty newbie question, but I'm
    > really not into all of this, I'm just a user trying to make
    > some pretty pictures for a student project :slight_smile:

Does

  fig = figure(frameon=False)

do what you want?

JDH

Hi John,

Does
  fig = figure(frameon=False)
do what you want?

Apperently not:

from pylab import *
x = range(10)
figure(1, frameon=False, facecolor='r')
scatter(x, x)
show()

Produces the picture given in attachment. I just want to get rid of
the damn red area :slight_smile: So my graph will takeup the whole space on the
viewport.

PS: If it's any good to you I'm planning to use it with NetworkX -
https://networkx.lanl.gov/

TIA!

···

--
Petar Marić
*e-mail: petar.maric@...287...
*mobile: +381 (64) 6122467

*icq: 224720322
*skype: petar_maric
*web: http://www.petarmaric.com/