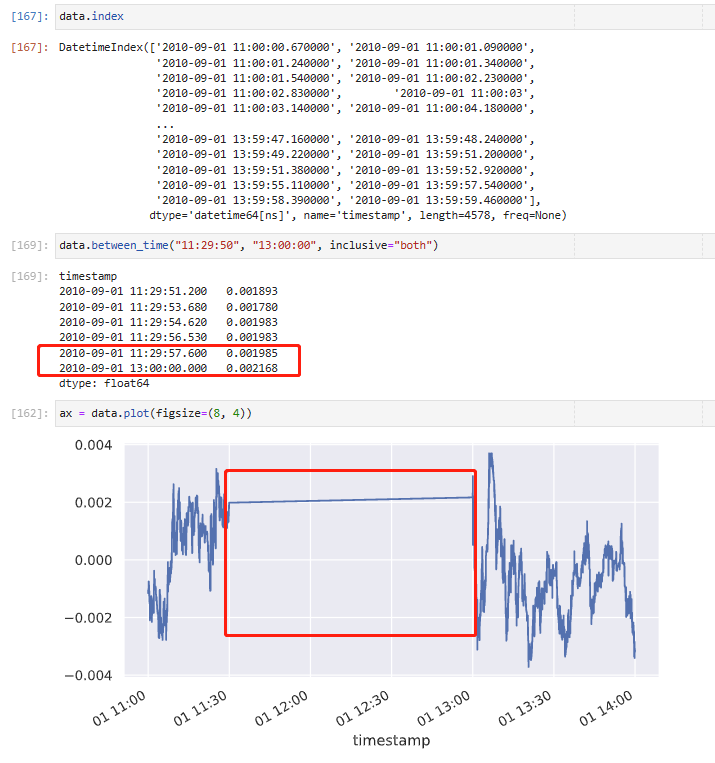
I am working with a time series data (pd.Series) with DatetimeIndex as index.
It is worth noting that there are no data between the ["11:30:00", "13:00:00").
And the problem is when I trying to plot the time series data, it seems that it will automatically fill the vacancy timestamp in the plot, as shown below:
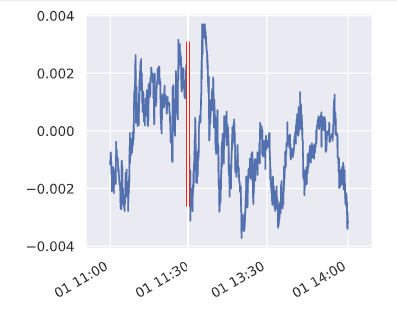
What I want to accomplish is the following result, still using the DatetimeIndex as x-ticks, but without the long horizontal line (or gap) between 11:30 to 13:00.
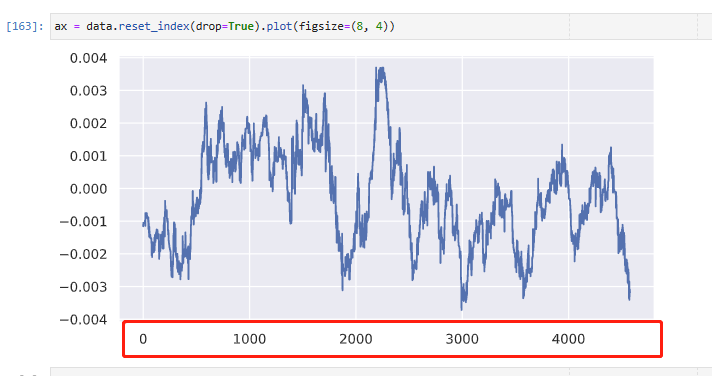
If you want the date to be on the xaxis (your index), and your data has gaps, then that is what Matplotlib/pandas will show. If you want sample number as your index, then switch to that, and you perhaps could label every 50th sample with a date if that is important. If you want to show the gap clearly, then you could make two subplots, and put the data from either side of the gap in each subplot.
What you are asking for is pretty non-standard, so you are going to have to do something special to make it work.