I want to visualize a function f(x,y,z). The DensityPlot3D function of Mathematica can be implemented.When I tried to do the same with the Scatter function of Matplotlib, I found it was not as precise as Mathematica. The main problem is that scatter function cannot realize continuous change of x, y and z axis data. If I drastically reduced the step size of the three axis data changes, the drawing time would be intolerable.So is there a better way I don’t know? Thanks!
Sorry, this is a bit vague. What do you mean by ‘not as precise’? Can you post a simple example to show what the problem is?
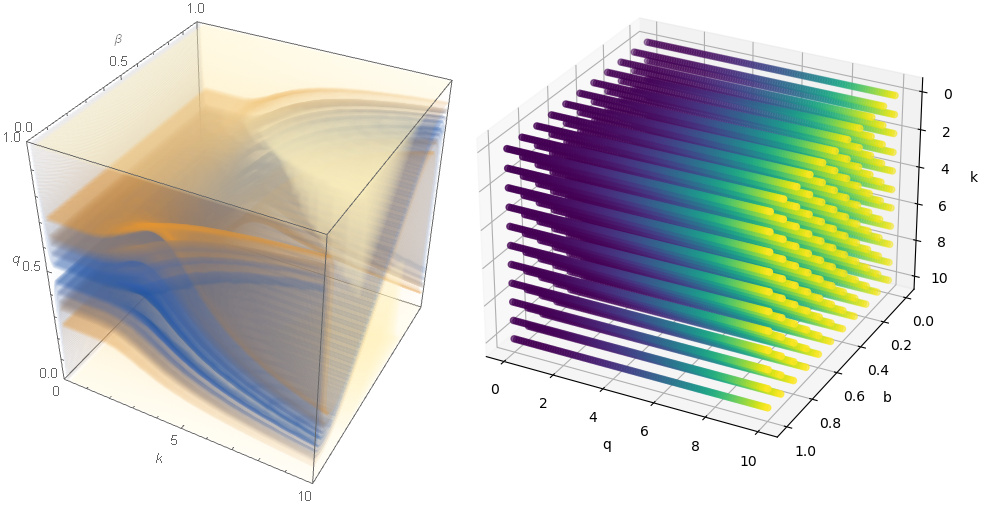
I am working with a function f(x,y,z). To visualize the result, I use the density value at each coordinate point in three-dimensional space to represent the value of the function. The size of the value is represented by color, such as the bigger the value, the darker the color, and the white space when the value is 0.Mathematica’s DensityPlot3D function does just that, as shown on the left.However, the result of using ax.scatter(x,y,z,c=density) in Matplotlib is shown in the figure on the right.Obviously, there’s a big difference.
It looks like what you want is to set the scatter non-opaque, passing e.g., alpha=0.2.
Though for complex 3D plots, Matplotlib may not be the best choice. You may also want to try Mayavi2.
Thanks a lot. I’ll try it.