How to make grid and border equal width

The following example is modified from:

https://matplotlib.org/stable/gallery/images_contours_and_fields/image_annotated_heatmap.html

import numpy as np
from matplotlib import pyplot as plt

from sciplotlib import utils

data = np.array([[0.8, 2.4, 2.5, 3.9, 0.0, 4.0, 0.0],
                 [2.4, 0.0, 4.0, 1.0, 2.7, 0.0, 0.0],
                 [1.1, 2.4, 0.8, 4.3, 1.9, 4.4, 0.0],
                 [0.6, 0.0, 0.3, 0.0, 3.1, 0.0, 0.0],
                 [0.7, 1.7, 0.6, 2.6, 2.2, 6.2, 0.0],
                 [1.3, 1.2, 0.0, 0.0, 0.0, 3.2, 5.1],
                 [0.1, 2.0, 0.0, 1.4, 0.0, 1.9, 6.3]])

plt.figure(figsize=(6, 4))
plt.rcParams["font.family"] = utils.font_family
im = plt.imshow(data, cmap="YlGn")

# Turn spines off
plt.gca().spines[:].set_visible(False)

plt.gca().set_xticks(np.arange(data.shape[1] + 1) - .5, minor=True)
plt.gca().set_yticks(np.arange(data.shape[0] + 1) - .5, minor=True)
plt.gca().grid(which="minor", color="black", linewidth=2)
plt.gca().tick_params(which="minor", bottom=False, left=False)

plt.tight_layout()

plt.gca().set_xticks(ticks=[])
plt.gca().set_yticks(ticks=[])

plt.savefig("test.pdf",
            bbox_inches="tight",
            transparent="True",
            pad_inches=0)

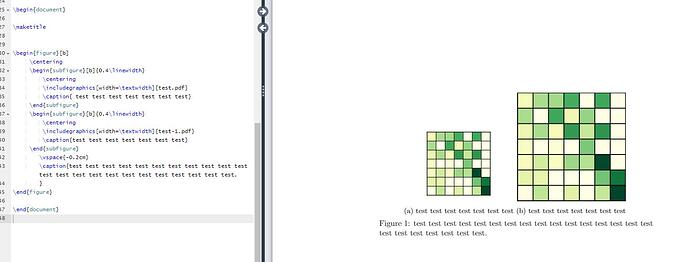
The results show that the image’s border is twice as small as the grid, the problem is how to make them the same width?
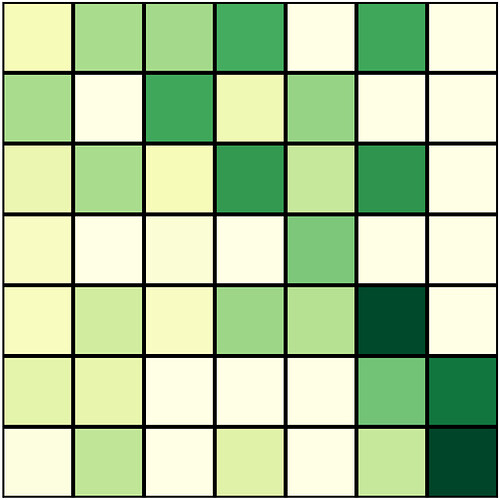
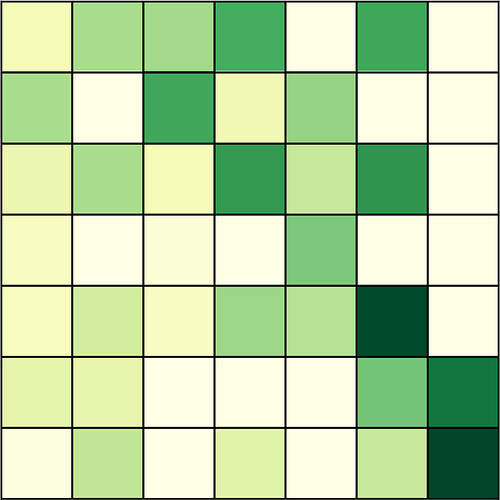
This is because bbox_inches=“tight” doesn’t know about the line width. Suggest you turn that off

Thank you for your reply, but changing this parameter has no effect.

Oh sorry, I didn’t see that you had set the grid linewidth=2. Do something like

for axis in ['top','bottom','left','right']:
    ax.spines[axis].set_linewidth(2)

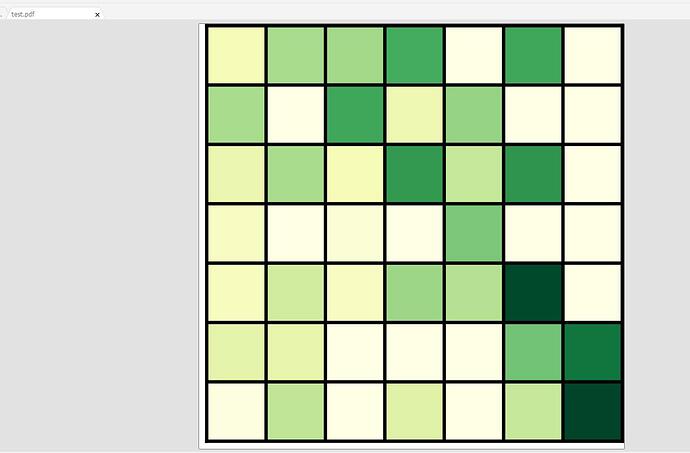
The linewidth is set to 2 because the grid cannot align the pixels, as shown in the figure below, the second line is clipped to the first line.

This phenomenon also exists in the picture of the above-mentioned webpage, so is there a way to solve this problem?

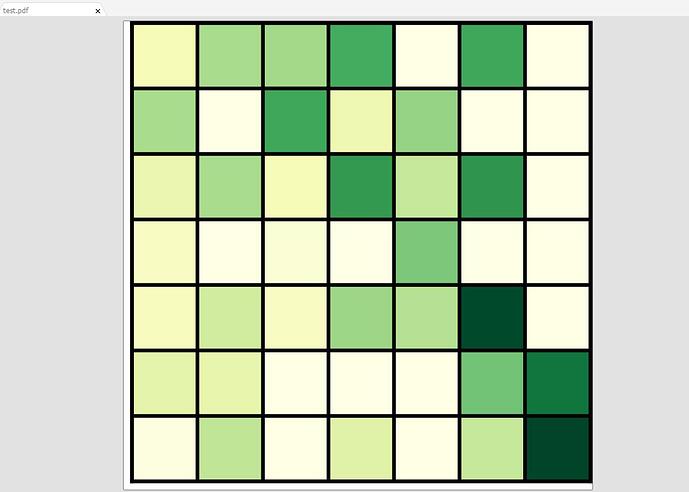
And, setting spines to 2 solved the original issue, thank you.

I had to set set bbox_inches=“tight” off and spines.set_linewidth(2) to make the grid the same width as the border, but this created a new problem.

I need to insert the resulting pdf file into LaTex as a figure, which makes it unusable with large borders.

Set pad_inches=a_small_positive_number instead of set bbox_inches=“tight” off will solve the issues above.

But how do I calculate this number so that it is exactly 1/2 of the linewidth?

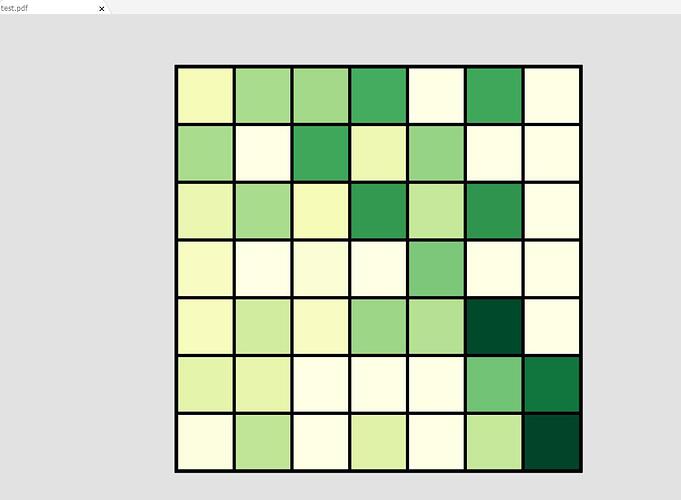
Another problem is that doing this makes the left and bottom more padding than the right and top, so the image is not centered when inserted into LaTeX. How to solve this?

For better or worse, grid lines snap to pixels. If you don’t want pixelated effects save with more dpi. You can always visually reduce the dpi afterwards. I believe that will also fix the offset with the bounding box. Your final question of how to make the clip be exactly the size of the width is probably not too hard. Bbox_inches can also take a 4 tuple and you can calculate the position in inches and then add 1/72 inch

import numpy as np
from matplotlib import pyplot as plt

from sciplotlib import utils

data = np.array([[0.8, 2.4, 2.5, 3.9, 0.0, 4.0, 0.0],
                 [2.4, 0.0, 4.0, 1.0, 2.7, 0.0, 0.0],
                 [1.1, 2.4, 0.8, 4.3, 1.9, 4.4, 0.0],
                 [0.6, 0.0, 0.3, 0.0, 3.1, 0.0, 0.0],
                 [0.7, 1.7, 0.6, 2.6, 2.2, 6.2, 0.0],
                 [1.3, 1.2, 0.0, 0.0, 0.0, 3.2, 5.1],
                 [0.1, 2.0, 0.0, 1.4, 0.0, 1.9, 6.3]])

plt.figure(figsize=(6, 4))
plt.rcParams["font.family"] = utils.font_family
im = plt.imshow(data, cmap="YlGn")

linewidth = 2

for axis in ['top', 'bottom', 'left', 'right']:
    plt.gca().spines[axis].set_linewidth(linewidth)

plt.gca().set_xticks(np.arange(data.shape[1] + 1) - .5, minor=True)
plt.gca().set_yticks(np.arange(data.shape[0] + 1) - .5, minor=True)
plt.gca().grid(which="minor", color="black", linewidth=linewidth)
plt.gca().tick_params(which="minor", bottom=False, left=False)

plt.tight_layout()

plt.gca().set_xticks(ticks=[])
plt.gca().set_yticks(ticks=[])

plt.savefig("test.pdf",
            bbox_inches="tight",
            transparent="True",
            pad_inches=1.0/72.0 * linewidth / 2.0)

Thanks for your reply, now I know how to calculate pad_inches. But I don’t fully understand your last reply, still can’t erase the left and bottom blank padding, can you help me see what else I need to do now?

I looked into this and it simply seems to be a big somehow. I’m not entirely sure where the bug originates - maybe space for the ticks?

import numpy as np
from matplotlib import pyplot as plt

data = np.array([[0.8, 2.4, 2.5, 3.9, 0.0, 4.0, 0.0],
                 [2.4, 0.0, 4.0, 1.0, 2.7, 0.0, 0.0],
                 [1.1, 2.4, 0.8, 4.3, 1.9, 4.4, 0.0],
                 [0.6, 0.0, 0.3, 0.0, 3.1, 0.0, 0.0],
                 [0.7, 1.7, 0.6, 2.6, 2.2, 6.2, 0.0],
                 [1.3, 1.2, 0.0, 0.0, 0.0, 3.2, 5.1],
                 [0.1, 2.0, 0.0, 1.4, 0.0, 1.9, 6.3]])

plt.figure(figsize=(6, 4))
plt.rcParams["font.family"] = "Times New Roman"
im = plt.imshow(data, cmap="YlGn")

linewidth = 2

for axis in ['top', 'bottom', 'left', 'right']:
    plt.gca().spines[axis].set_linewidth(linewidth)

plt.gca().set_xticks(np.arange(data.shape[1] + 1) - .5, minor=True)
plt.gca().set_yticks(np.arange(data.shape[0] + 1) - .5, minor=True)
plt.gca().grid(which="minor", color="black", linewidth=linewidth)
plt.gca().tick_params(which="minor", bottom=False, left=False)

plt.tight_layout()

plt.gca().set_xticks(ticks=[])
plt.gca().set_yticks(ticks=[])

plt.gca().tick_params(axis="both",
                      which="major",
                      left=False,
                      bottom=False,
                      labelleft=False,
                      labelbottom=False)

plt.savefig("test.pdf",
            bbox_inches="tight",
            transparent="True",
            pad_inches=1.0 / 72.0 * linewidth / 2.0)

Thank you very much, it was indeed an issue with ticks, all issues are solved now.

Great - I was just about to try removing the ticks altogether. A bit annoying that invisible ticks still reserve space for themselves. I seem to remember that as an issue, but I’m not clear why it is not fixed. Perhaps worth opening a big report, or checking the old issues.