I want to see in PyCharm good old matplotlib window with options. I mean buttons on the bottom. They let me zoom chart and move from one part to another.
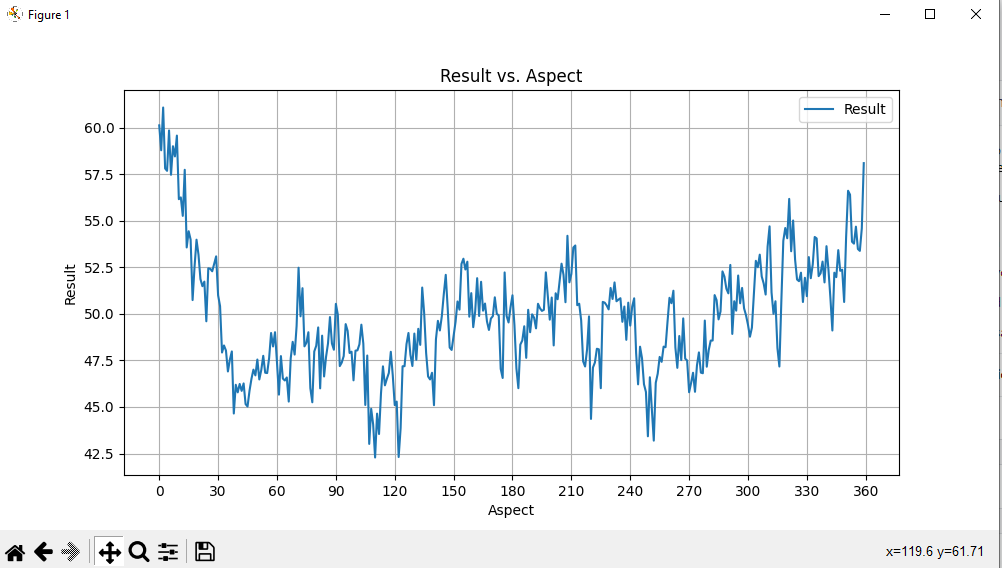
But in PyCharm such chart is just a picture without interactive options:
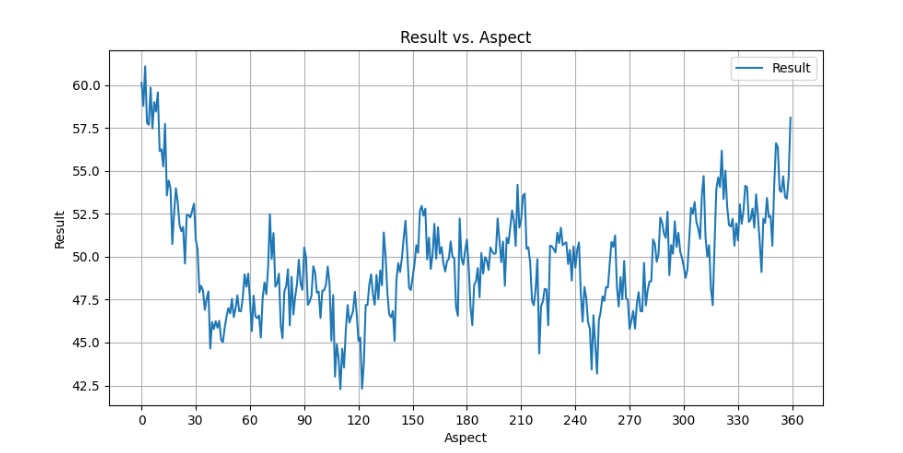
I cannot travel through it.
How to create chart with interface buttons in PyCharm?