Hi.
I need some help with this problem.
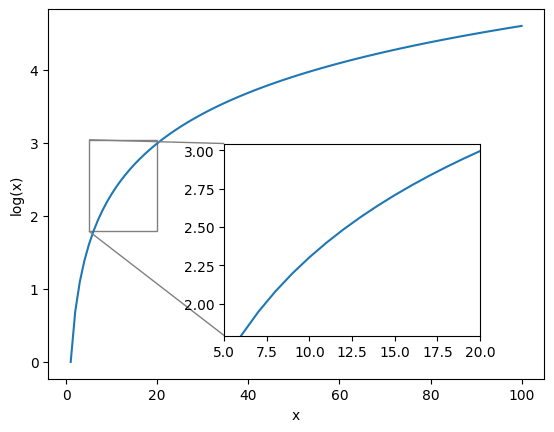
So, i want to plot a graph like this below, but with the inset on scale exp(x).
The graph is y = log(x) and the inset i want is y = exp(log(x)) = x, showing a straight and no a curve. How do this?

Hi.
I need some help with this problem.
So, i want to plot a graph like this below, but with the inset on scale exp(x).
The graph is y = log(x) and the inset i want is y = exp(log(x)) = x, showing a straight and no a curve. How do this?

You should be able to set the scale of both the x and y axis of the inset axes just like you would on the main one.
Could you provide us with the code snippet you used to generate that figure?