How can I make a 3D plot without showing the axes?
When plotting a 3d plot, Matplotlib not only draws the x, y, and z
axes, it also draws light gray grids on the x-y, y-z, and x-z planes.
I would like to draw a "free-floating" 3D graph, with none of these
elements. My matplotlib.__version__ is 1.0.1.
Stuff I've tried:
# Doesn't work; this hides the plot, not the axes
my_3d_axes.set_visible(False)
# Doesn't do anything. Also, there's no get_zaxis() function.
my_3d_axes.get_xaxis().set_visible(False)
my_3d_axes.get_yaxis().set_visible(False)
-- Matt
Matt,
Try “my_3d_axes.set_axis_off()”. I should probably override set_visible() to work as expected…
Ben Root
···
On Wed, Sep 7, 2011 at 1:34 PM, Matthew Koichi Grimes <mkg@…3771…> wrote:
How can I make a 3D plot without showing the axes?
When plotting a 3d plot, Matplotlib not only draws the x, y, and z
axes, it also draws light gray grids on the x-y, y-z, and x-z planes.
I would like to draw a “free-floating” 3D graph, with none of these
elements. My matplotlib.version is 1.0.1.
Stuff I’ve tried:
Doesn’t work; this hides the plot, not the axes
my_3d_axes.set_visible(False)
Doesn’t do anything. Also, there’s no get_zaxis() function.
my_3d_axes.get_xaxis().set_visible(False)
my_3d_axes.get_yaxis().set_visible(False)
– Matt
This no longer seems to work with matplotlib 1.0.1.
As a quick example:
import numpy as np
import matplotlib.pyplot as plt
from mpl_toolkits.mplot3d import Axes3D
fig = plt.figure()
ax = fig.add_subplot(111, projection=‘3d’)
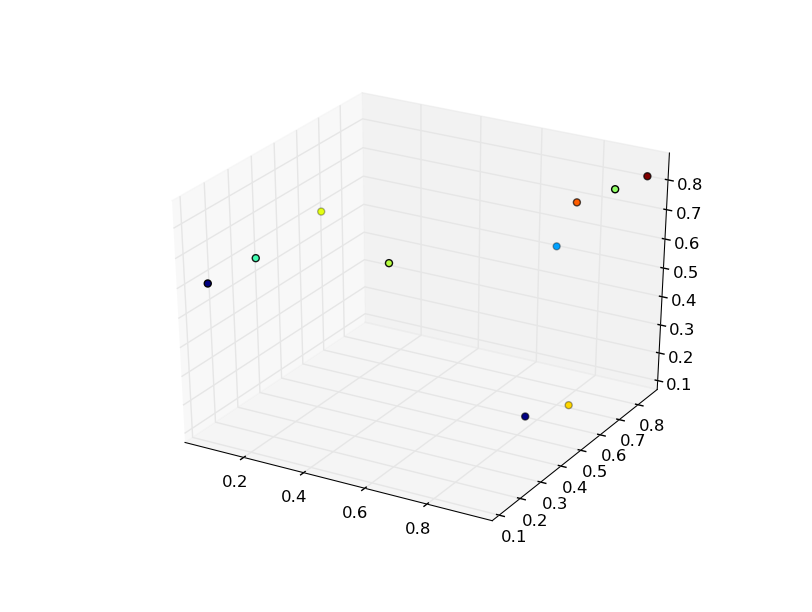
x,y,z,c = np.random.random((4,10))
ax.scatter(x, y, z, c=c)
ax.set_axis_off()
plt.show()
The attached .png shows the result on my system… Is this a bug, or am I doing something strange?
Thanks!
-Joe
···
On Wed, Sep 7, 2011 at 1:52 PM, Benjamin Root <ben.root@…1304…> wrote:
On Wed, Sep 7, 2011 at 1:34 PM, Matthew Koichi Grimes <mkg@…1418…> wrote:
How can I make a 3D plot without showing the axes?
When plotting a 3d plot, Matplotlib not only draws the x, y, and z
axes, it also draws light gray grids on the x-y, y-z, and x-z planes.
I would like to draw a “free-floating” 3D graph, with none of these
elements. My matplotlib.version is 1.0.1.
Stuff I’ve tried:
Doesn’t work; this hides the plot, not the axes
my_3d_axes.set_visible(False)
Doesn’t do anything. Also, there’s no get_zaxis() function.
my_3d_axes.get_xaxis().set_visible(False)
my_3d_axes.get_yaxis().set_visible(False)
– Matt
Matt,
Try “my_3d_axes.set_axis_off()”. I should probably override set_visible() to work as expected…
Ben Root
Using storage to extend the benefits of virtualization and iSCSI
Virtualization increases hardware utilization and delivers a new level of
agility. Learn what those decisions are and how to modernize your storage
and backup environments for virtualization.
http://www.accelacomm.com/jaw/sfnl/114/51434361/
Matplotlib-users mailing list
[email protected]
https://lists.sourceforge.net/lists/listinfo/matplotlib-users
Hmmm, try putting that call right after the add_subplot() call. I don’t have time to test it out right now, but I wonder if the axes are being drawn once prior to the call to set_axis_off(). I would also be interested to know if the axes disappear when you interact with it.
Ben Root
···
On Wed, Sep 7, 2011 at 2:14 PM, Joe Kington <jkington@…150…> wrote:
This no longer seems to work with matplotlib 1.0.1.
As a quick example:
import numpy as np
import matplotlib.pyplot as plt
from mpl_toolkits.mplot3d import Axes3D
fig = plt.figure()
ax = fig.add_subplot(111, projection=‘3d’)
x,y,z,c = np.random.random((4,10))
ax.scatter(x, y, z, c=c)
ax.set_axis_off()
plt.show()
The attached .png shows the result on my system… Is this a bug, or am I doing something strange?
Thanks!
-Joe
I see the same thing here (from within ipython -pylab), and moving the ax.set_axis_off() immediately after the add_subplot call doesn’t change anything. Interacting with the plot doesn’t change anything either.
Ethan
···
On Sep 7, 2011, at 1:21 PM, Benjamin Root wrote:
On Wed, Sep 7, 2011 at 2:14 PM, Joe Kington <jkington@…150…> wrote:
This no longer seems to work with matplotlib 1.0.1.
As a quick example:
import numpy as np
import matplotlib.pyplot as plt
from mpl_toolkits.mplot3d import Axes3D
fig = plt.figure()
ax = fig.add_subplot(111, projection=‘3d’)
x,y,z,c = np.random.random((4,10))
ax.scatter(x, y, z, c=c)
ax.set_axis_off()
plt.show()
The attached .png shows the result on my system… Is this a bug, or am I doing something strange?
Thanks!
-Joe
Hmmm, try putting that call right after the add_subplot() call. I don’t have time to test it out right now, but I wonder if the axes are being drawn once prior to the call to set_axis_off(). I would also be interested to know if the axes disappear when you interact with it.
Ben Root
Using storage to extend the benefits of virtualization and iSCSI
Virtualization increases hardware utilization and delivers a new level of
agility. Learn what those decisions are and how to modernize your storage
and backup environments for virtualization.
http://www.accelacomm.com/jaw/sfnl/114/51434361/_______________________________________________
Matplotlib-users mailing list
[email protected]
matplotlib-users List Signup and Options
I tried Joe’s code, with the call to ax.set_axis_off() moved to right after add_subplot(), as Ben suggested. The axes are still not disappearing, nor do they disappear when I interact with it (by rotating the plot).
– Matt
···
On Wed, Sep 7, 2011 at 3:21 PM, Benjamin Root <ben.root@…1304…> wrote:
On Wed, Sep 7, 2011 at 2:14 PM, Joe Kington <jkington@…150…> wrote:
This no longer seems to work with matplotlib 1.0.1.
As a quick example:
import numpy as np
import matplotlib.pyplot as plt
from mpl_toolkits.mplot3d import Axes3D
fig = plt.figure()
ax = fig.add_subplot(111, projection=‘3d’)
x,y,z,c = np.random.random((4,10))
ax.scatter(x, y, z, c=c)
ax.set_axis_off()
plt.show()
The attached .png shows the result on my system… Is this a bug, or am I doing something strange?
Thanks!
-Joe
Hmmm, try putting that call right after the add_subplot() call. I don’t have time to test it out right now, but I wonder if the axes are being drawn once prior to the call to set_axis_off(). I would also be interested to know if the axes disappear when you interact with it.
Ben Root
Interestingly, things work perfectly with the latest build from guithub. Presumably the bug was fixed already?
···
On Wed, Sep 7, 2011 at 2:40 PM, Matthew Koichi Grimes <mkg@…1418…> wrote:
I tried Joe’s code, with the call to ax.set_axis_off() moved to right after add_subplot(), as Ben suggested. The axes are still not disappearing, nor do they disappear when I interact with it (by rotating the plot).
– Matt
On Wed, Sep 7, 2011 at 3:21 PM, Benjamin Root <ben.root@…1304…> wrote:
On Wed, Sep 7, 2011 at 2:14 PM, Joe Kington <jkington@…150…> wrote:
This no longer seems to work with matplotlib 1.0.1.
As a quick example:
import numpy as np
import matplotlib.pyplot as plt
from mpl_toolkits.mplot3d import Axes3D
fig = plt.figure()
ax = fig.add_subplot(111, projection=‘3d’)
x,y,z,c = np.random.random((4,10))
ax.scatter(x, y, z, c=c)
ax.set_axis_off()
plt.show()
The attached .png shows the result on my system… Is this a bug, or am I doing something strange?
Thanks!
-Joe
Hmmm, try putting that call right after the add_subplot() call. I don’t have time to test it out right now, but I wonder if the axes are being drawn once prior to the call to set_axis_off(). I would also be interested to know if the axes disappear when you interact with it.
Ben Root
Uhm, sure! I totally intended for that nasty bug to be fixed for the upcoming release… <_<
Seriously, though, I made many changes to mplot3d as a part of my refactoring efforts. I would not be surprised if things magically break or get fixed because of it. I am glad you can confirm that the latest build works. I will take a peek at the v1.0.1 branch and see if there is an obvious fix for them.
Ben Root
···
On Wed, Sep 7, 2011 at 2:43 PM, Joe Kington <jkington@…150…> wrote:
Interestingly, things work perfectly with the latest build from guithub. Presumably the bug was fixed already?
Thanks Ben, I for one would be very interested in any workarounds you might find that don’t require an upgrade from 1.0.1.
– Matt
···
On Wed, Sep 7, 2011 at 4:04 PM, Benjamin Root <ben.root@…3421…> wrote:
On Wed, Sep 7, 2011 at 2:43 PM, Joe Kington <jkington@…150…> wrote:
Interestingly, things work perfectly with the latest build from guithub. Presumably the bug was fixed already?
Uhm, sure! I totally intended for that nasty bug to be fixed for the upcoming release… <_<
Seriously, though, I made many changes to mplot3d as a part of my refactoring efforts. I would not be surprised if things magically break or get fixed because of it. I am glad you can confirm that the latest build works. I will take a peek at the v1.0.1 branch and see if there is an obvious fix for them.
Ben Root
Ok, looks like the hiding of the 3d axes was a feature added after the v1.0 release (but before I started working on mplot3d). This patch should enable the basic feature without interfering with existing functions. To hide the axes, you would have to set the private member “_axis3don” to False, like so:
ax = plt.gca(projection=‘3d’)
ax._axis3don = False
If you do it this way, then you will get what you want now, and your code will still be compatible with mplot3d when you upgrade (although the preferred method would be to call set_axis_on() or set_axis_off()).
I hope that helps!
Ben Root
hide3daxes.patch (935 Bytes)
···
On Wed, Sep 7, 2011 at 3:13 PM, Matthew Koichi Grimes <mkg@…3771…> wrote:
Thanks Ben, I for one would be very interested in any workarounds you might find that don’t require an upgrade from 1.0.1.
– Matt