I have two sets of points, and fill the area between the two curves with fill_between function. But how to fill the area with fill_betweenx only within the interaction part?
import matplotlib.pyplot as plt
import numpy as np
import scipy.interpolate
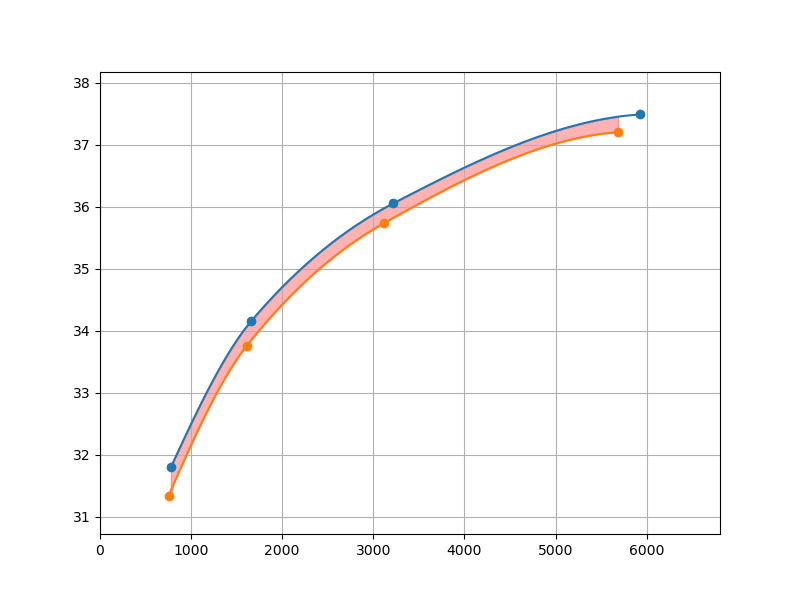
R1 = [779.01, 1660.89, 3220.62, 5927.36]
PSNR1 = [31.799098, 34.155477, 36.053423, 37.485558]
R2 = [752.33, 1608.90, 3114.10, 5685.72]
PSNR2 = [31.336015, 33.752160, 35.730303, 37.200365]
min_int = min(min(R1), min(R2))
max_int = max(max(R1), max(R2))
lin = np.linspace(min_int, max_int, num=100, retstep=True)
samples = lin[0]
v1 = scipy.interpolate.pchip_interpolate(np.sort(R1), np.sort(PSNR1), samples)
v2 = scipy.interpolate.pchip_interpolate(np.sort(R2), np.sort(PSNR2), samples)
R1_left = np.argwhere(np.array(samples) >= R1[0])[0][0]
R1_right = np.argwhere(np.array(samples) >= R1[-1])[0][0]
R1_int = [R1[0], *samples[R1_left:R1_right], R1[-1]]
PSNR1_int = [PSNR1[0], *v1[R1_left:R1_right], PSNR1[-1]]
R2_left = np.argwhere(np.array(samples) >= R2[0])[0][0]
R2_right = np.argwhere(np.array(samples) >= R2[-1])[0][0]
R2_int = [R2[0], *samples[R2_left:R2_right], R2[-1]]
PSNR2_int = [PSNR2[0], *v2[R2_left:R2_right], PSNR2[-1]]
fig, ax = plt.subplots(figsize=(8, 6))
p = ax.plot(R1_int, PSNR1_int, R2_int, PSNR2_int)
ax.plot(R1, PSNR1, "o", color=p[0].get_color(), label="before")
ax.plot(R2, PSNR2, "o", color=p[1].get_color(), label="after")
min_interact = max(min(R1), min(R2))
max_interact = min(max(R1), max(R2))
R_left = np.argwhere(np.array(samples) >= min_interact)[0][0]
R_right = np.argwhere(np.array(samples) >= max_interact)[0][0]
R_int = [min_interact, *samples[R_left:R_right - 1], max_interact]
PSNR1_int = [v1[R_left - 1] if min(R1) <= min_interact else PSNR1[0],
*v1[R_left:R_right - 1],
PSNR1[-1] if max(R1) < max_interact else v1[R_right]]
PSNR2_int = [v2[R_left - 1] if min(R2) <= min_interact else PSNR2[0],
*v2[R_left:R_right - 1],
PSNR2[-1] if max(R2) < max_interact else v2[R_right]]
plt.fill_between(x=R_int, y1=PSNR1_int, y2=PSNR2_int,
color='red',
alpha=0.3)
ax.set_xlim([0, ax.get_xlim()[1] * 1.1])
ax.set_ylim([ax.get_ylim()[0] * 0.99, ax.get_ylim()[1] * 1.01])
plt.grid(True)
plt.show()