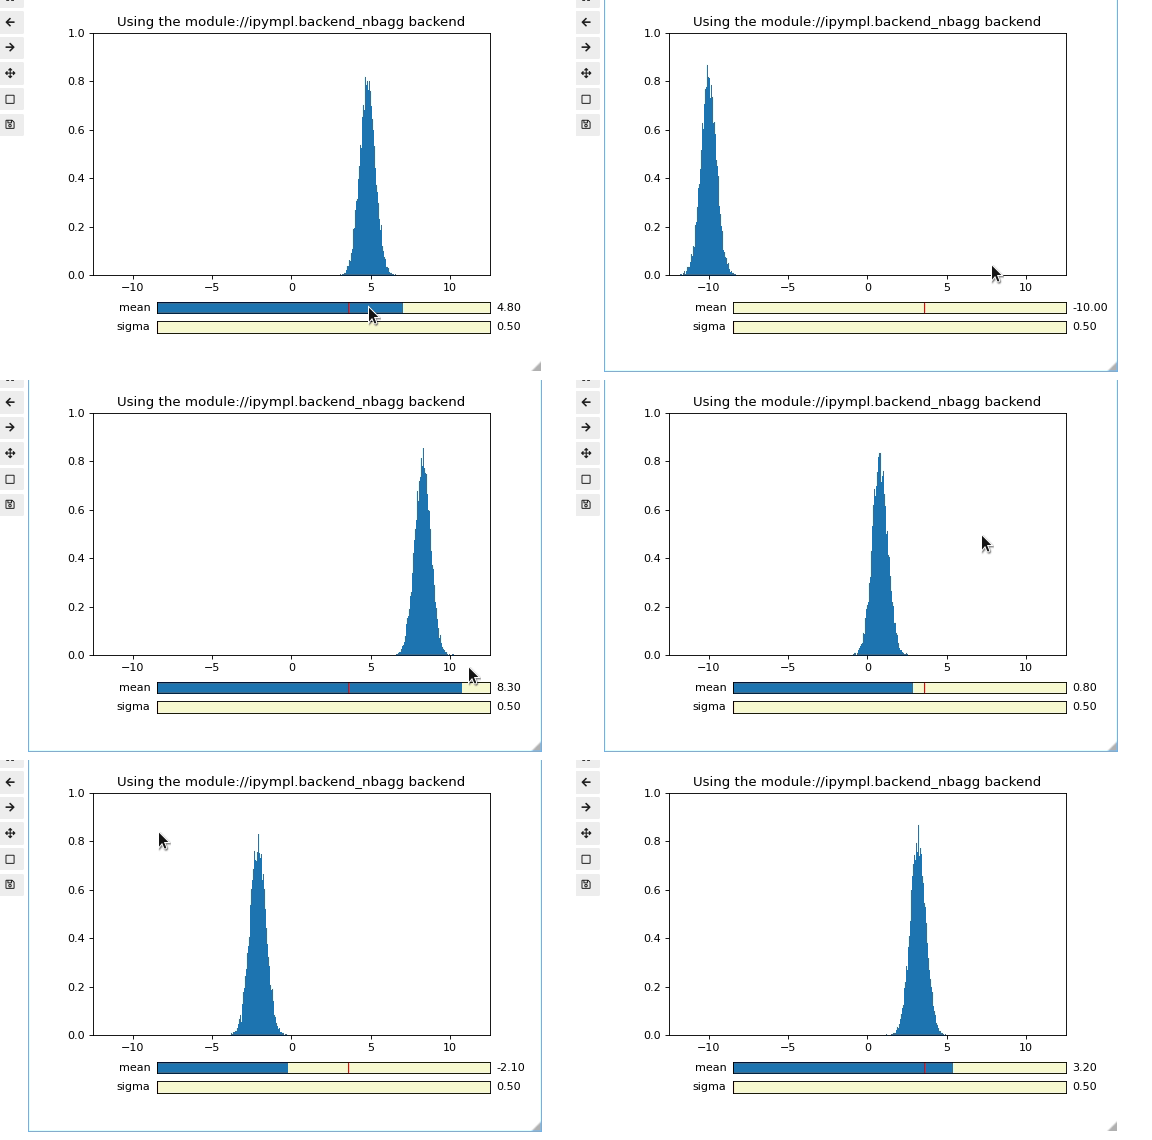
How to eliminate ghosting when removing Rectangle patches from an axis?

I am trying to make a histogram that will change as a function of ipywidgets sliders. Unfortunately there is no equivalent of set_data for a histogram so I am attempting to roll my own by manipulating the the patches of the axis. Unfortunately I don’t seem to always remove all of the pre-existing patches, resulting in a ghosting effect. My current approach is that on every update of the slider I:

  1. remove all the patches from the axis object
  2. compute new heights and bins
  3. create new Rectangle patches and add them to object
  4. fig.canvas.draw()

Am I missing an important step in removing patches from an axis? Any help in eliminating this ghosting would be much appreciated. (A minimal, hopefully working, example follows the gif)

Code to reproduce:
In a jupyter notebok or jupyterlab run

%matplotlib ipympl
import ipywidgets as widgets
import matplotlib.pyplot as plt
from matplotlib.patches import Rectangle
import numpy as np
plt.ioff()
fig, ax = plt.subplots()
plt.ion()
def f(loc, scale):
    return np.random.randn(10000)*scale + loc

tops, bins, patches = ax.hist(f(0,1.5), bins='auto')
def update_plot(change):
    for p in ax.patches:
        p.set_visible(False)
        p.remove()
    arr = f(loc_slider.value, scale_slider.value)
    heights, bins = np.histogram(arr, bins='auto')
    width = bins[1]-bins[0]
    for i in range(len(heights)):
        p = Rectangle((bins[i],0), width=width, height=heights[i])
        ax.add_patch(p)
    fig.canvas.draw()
loc_slider = widgets.FloatSlider(min=-10,max=10,description='loc')
scale_slider = widgets.FloatSlider(min=.1,max=10,value=1.5,description='scale')
loc_slider.observe(update_plot, names=['value'])
scale_slider.observe(update_plot, names=['value'])
ax.set_xlim([-12.5,12.5])
display(loc_slider)
display(scale_slider)
display(fig.canvas)

I don’t think this is a jupyter problem as I see the same if I set the backend to qt with %matplotlib qt

I’m also pretty sure this isn’t a bug and instead is me not doing something I should. If this is a bug I’m happy to open a bug report.

A few notes:

  1. Using fewer points (10000 -> 1000) does not help
  2. I can’t use something like cla because that would remove other content such as lines
  3. eventually I will not remove all the patches, instead I will keep track of the histogram patches and replace them
  4. Updating the existing patches works better, but is not a solution as I may want to be able to change the number of bins.
  5. I tried putting an extra fig.canvas.draw earlier, sadly this did not help :frowning:

Versions:
ipympl: master
ipywidgets: 7.5.1
matplotlib: 3.2.2
jupyterlab: 2.2.2

Thanks,
Ian

Try putting a threading lock on your update_plot function.

I am not sure how IPywidgets services the requests under the hood, but if the updates from the front end are handled at all concurrently you have two (or more) threads (?!) trying to update the figure at the same time and stepping on each others toes…

Hi @tacaswell, thanks for the suggestion! Unfortunately that did not seem to solve this. I tried to use both the @throttle and @debounce decorators from https://ipywidgets.readthedocs.io/en/latest/examples/Widget%20Events.html#Debouncing and even with a 1 second wait time I saw the same. Here are gifs of both with update plot defined as:

@throttle(1.0) # or @debounce(1.0)
def update_plot(change):

@throttle(1.0)

@debounce(1.0)

To investigate whether this is a consequence of Jupyter/widgets and differing event loops I made the same example using the Matplotlib builtin sliders with the Qt5Agg backend and saw the same effect. (I ran this as a python file from the terminal so there should be no jupyter/ipython around to mess with things)


Code:

import numpy as np
import matplotlib.pyplot as plt
from matplotlib.widgets import Slider
from matplotlib.patches import Rectangle
from matplotlib import get_backend

def f(loc, scale):
    return np.random.randn(10000)*scale + loc

fig, ax = plt.subplots()
plt.subplots_adjust( bottom=0.25)
tops, bins, patches = ax.hist(f(0,1.5), bins='auto')

axcolor = 'lightgoldenrodyellow'
ax_sigma = plt.axes([0.25, 0.1, 0.65, 0.03], facecolor=axcolor)
ax_mean = plt.axes([0.25, 0.15, 0.65, 0.03], facecolor=axcolor)

loc_slider = Slider(ax_mean, 'mean', -10, 10, valinit=1.5, valstep=.1)
scale_slider = Slider(ax_sigma, 'sigma', 0.1, 10.0, valinit=.1)

def update_plot(change):
    for p in ax.patches:
        p.set_visible(False)
        p.remove()
    arr = f(loc_slider.val, scale_slider.val)
    heights, bins = np.histogram(arr, bins='auto')
    width = bins[1]-bins[0]
    for i in range(len(heights)):
        p = Rectangle((bins[i],0), width=width, height=heights[i])
        ax.add_patch(p)
    fig.canvas.draw() # same effect with draw_idle

loc_slider.on_changed(update_plot)
scale_slider.on_changed(update_plot)

ax.set_title(f"Using the {get_backend()} backend")
plt.show()

Am I maybe missing another place where patches are stored? Or perhaps remove doesn’t work in the way I’d expect?

Also for the sake of completeness I tried using the same throttle and debounce decorators with the script version. But this seemed to prevent any updates at all.

This is a Python issue as you are modifying a list as you are iterating through it. While it does correctly remove each patch as you walk across it, because you are mutating the list as you end up “skipping” some of the patches. By list-ifying it first you grab a snapshot of the list and then iterate over that while removing the elements from the internal list.

In general, it is better to keep track of what artists you want to manipulate independent of Matplotlib’s internal view of them (for example is this case if you wanted to add N histograms multiple copies of this function bound to different data sets would step on each other’s toes!)

We are also look at deprecating ax.patches ( https://github.com/matplotlib/matplotlib/pull/18216 ) in its current form.

That worked, thanks so much!

In general, it is better to keep track of what artists you want to manipulate independent of Matplotlib’s internal view of them

That makes sense. However, I think I need to do some internal manipulation because ax.add_patch will only ever append to the patch list, never insert. This is important for me because all patches have the same zorder. So if I make an interactive histogram and then later on a user adds another (not tied to sliders) histogram using pyplot then I will need to insert my new rectangle artists into the same section of the patch list. Is that still going to be possible with the changes post deprecation?

I.e. I want to be able to make a substitution that looks like this:
ax.patches: [ other1, other2, rect1, rect2, rect3, other3]
to
ax.patches: [ other1, other2, new1, new2, new3, new4, other3]

To get around the nightmare of handling precise removal and insertion into the patches list it seems that I should use a higher level object that would have a single spot on the artist list but that I could modify the patches that it owns (i.e. have an equivalent to set_data). I thought that https://matplotlib.org/api/collections_api.html#matplotlib.collections.PatchCollection might be this but there doesn’t seem to be a way to update the patches it owns? Do you have any suggestions on what, if any, would be the correct container to use?

Patches have a zorder. I wouldn’t rely on the order in the patch list for anything, and I wouldn’t try to insert into that list in place. I think it was probably a mistake to make that list public in the first place, and as a user, its probably safest to think of it as a private attribute. If you need patches drawn in a certain order, then zorder is how that is done.

1 Like

You probably what you want to be using https://matplotlib.org/api/collections_api.html#matplotlib.collections.BrokenBarHCollection but the documentation is a bit sparse so you will likely have to dive into the source to sort out which of the set_* methods do what you want (and then open a PR improving the docs :pray:).

I am 95% sure that this code pre-dates the “under-score-as-private” attribute convention being widely used.

The issue I found with zorder is that it’s not a complete description of draw order, the order in the patch list also matters. So since all patches will have zorder 1 by default so it would get really tricky to preserve overlay order if I also allow a user to run arbitrary commands after invoking my function. That said the solution I’ve ended up at also doesn’t do this perfectly, but I expect it will once the linked PR is merged.

Good to know that I should treat those lists as private though, thanks! It may be worth updating the documentation in https://matplotlib.org/tutorials/intermediate/artists.html which currently has a section that reads

You should not add objects directly to the Axes.lines or Axes.patches lists unless you know exactly what you are doing, because the Axes needs to do a few things when it creates and adds an object.

This was probably primarily hubris on my part, but after reading that I essentially thought: “It’s ok to do this”, at least so long as I copied the other stuff done by the add_patch method (e.g. set clip paths and whatnot)

@tacaswell I don’t BrokenBarH was quite what I was looking for (also there doesn’t seem to be a BrokenBarV?) however your note about diving into the source inspired me to look once more at PatchCollection which was indeed the solution! Complete code using the collection

import numpy as np
import matplotlib.pyplot as plt
from matplotlib.widgets import Slider
from matplotlib.patches import Rectangle
from matplotlib.collections import PatchCollection
from matplotlib import get_backend

def f(loc, scale):
    return np.random.randn(10000)*scale + loc

fig, ax = plt.subplots()
plt.subplots_adjust( bottom=0.25)
pc = PatchCollection([])
ax.add_collection(pc)
axcolor = 'lightgoldenrodyellow'
ax_sigma = plt.axes([0.25, 0.1, 0.65, 0.03], facecolor=axcolor)
ax_mean = plt.axes([0.25, 0.15, 0.65, 0.03], facecolor=axcolor)

loc_slider = Slider(ax_mean, 'mean', -10, 10, valinit=1.5, valstep=.1)
scale_slider = Slider(ax_sigma, 'sigma', 0.5, 10.0, valinit=.1)

def update_plot(change):
    arr = f(loc_slider.val, scale_slider.val)
    heights, bins = np.histogram(arr, bins='auto', density=True)
    width = bins[1]-bins[0]
    new_patches = []
    for i in range(len(heights)):
        new_patches.append(Rectangle((bins[i],0), width=width, height=heights[i]))
    pc.set_paths(new_patches)
    fig.canvas.draw() # same effect with draw_idle

loc_slider.on_changed(update_plot)
scale_slider.on_changed(update_plot)

update_plot(None) # call once to populate the initial state
ax.set_title(f"Using the {get_backend()} backend")
ax.set_ylim([0,1])
ax.set_xlim([-12.5,12.5])
plt.show()

Which works well, although if you use the default Matplotlib sliders inside of ipympl you get some pretty fun sideeffects due to the lag of all the round trips:
weeeeeeee

which I’m actually not sure I understand. Using ipywidgets sliders is far snappier, but there ought to be same number of frontend ↔ roundtrips?

set_* methods do what you want (and then open a PR improving the docs :pray:).

Ultimately it was the set_paths method I wanted. Which was pretty confusing, because I expected to find a set_patches method. Would it make sense to add such a method?

As for improving the docs I think if I don’t do that then I forever lose my rights to complain about matplotlb documentation :stuck_out_tongue: so for that among other reasons I’m happy to. But I’m a little unsure what to create/add to here?

  • The docstrings?
  • A small tutorial?
  • an example?

any suggestions on form would be much appreciated. I also still have never managed to build the docs locally, but I will open another post on that topic…

Is it ok for me to lift the code in Axes.hist that generates the patches and use it in my 3rd party library? To say the least it is …long… and I’d like to be able to support the full range of what hist can do but add interactivity via sliders.

Ideally, hist would return something akin to a Line2D that provided a set_data method, but short of that, I think my best bet is a straight copy of the linked lines.

I suppose I could also keep a dummy axis around and generate the patches with it, but I think that would mess the results of gca.

Well there is a pr in to do just what you are asking.

For future me/someone else ending up here: Do you mean this one? https://github.com/matplotlib/matplotlib/pull/18275

That looks fantastic.

Thats correct #18275