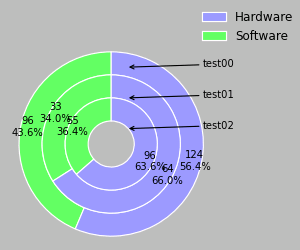
thanks to Joe Kington‘s help, i got this pie donuts
i have modified code to generate pie base one the Num of list.
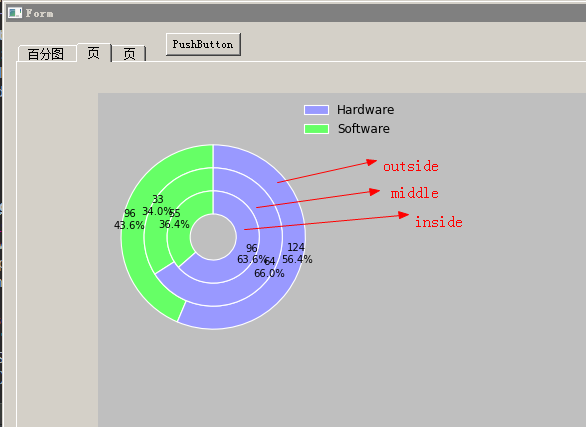
but i do not know how to draw the text label like below, i need label inform of each pie . pls give me some guide.
thanks a lot
···
#################################
from future import unicode_literals
import matplotlib.pyplot as plt
import numpy as np
import sys # os, random
from PyQt4 import QtGui, QtCore
#from numpy import arange, sin, pi
from matplotlib import font_manager as fm
from matplotlib.backends.backend_qt4agg import FigureCanvasQTAgg as FigureCanvas
#from matplotlib.figure import Figure
from mychart_ui import Ui_Form
class MyMplCanvas(FigureCanvas):
“”“Ultimately, this is a QWidget (as well as a FigureCanvasAgg, etc.).”“”
def init(self, parent=None, width=5, height=4, dpi=100):
#fig = Figure(figsize=(width, height), dpi=dpi)
self.axes = fig.add_subplot(111)
We want the axes cleared every time plot() is called
#self.axes.hold(False)
plt.rcParams[‘font.size’] = 9
plt.rcParams[‘font.weight’] = ‘normal’
self.fig, self.axes = plt.subplots()
self.compute_initial_figure()
FigureCanvas.init(self, self.fig)
self.setParent(parent)
FigureCanvas.setSizePolicy(self,
QtGui.QSizePolicy.Expanding,
QtGui.QSizePolicy.Expanding)
FigureCanvas.updateGeometry(self)
def compute_initial_figure(self):
pass
class MyStaticMplCanvas(MyMplCanvas):
“”“Simple canvas with a sine plot.”“”
def compute_initial_figure(self):
#fig, ax = plt.subplots()
#ax.axis = (‘equal’)
data = [[96, 124],[33, 64],[55, 96]]
header = [‘Hardware’, ‘Software’]
def pie_plot(myfig,myaxes,data):
fig = myfig
ax = myaxes
ax.set_position([-0.12, 0.4, 0.6, 0.6])
ax.axis(‘equal’)
ls = data
r_len = 0.6
width = r_len/(len(ls)+1)
print width
kwargs = dict(colors=[‘#66FF66’, ‘#9999FF’, ‘#FF9999’], startangle=90)
proptease = fm.FontProperties()
proptease.set_size(‘xx-small’)
circle_ls =
for i in range(len(ls)):
print i
circle_ls.append(pie(ax, ls[i], radius=r_len-width*i, pctdistance=1-width/2, **kwargs))
outside = pie(ax, ls[0], radius=r_len, pctdistance=1-width/2, **kwargs)
middle = pie(ax,ls[1] , radius=r_len-width,
pctdistance=1-width/2, **kwargs)
middle2 = pie(ax,ls[1] , radius=r_len-width*2,
pctdistance=1-width/2, **kwargs)
inside = pie(ax,ls[2] , radius=r_len-width*3,
pctdistance=1-width/2, **kwargs)
plt.setp(circle_ls, width=width, edgecolor=‘white’)
ax.legend(circle_ls[0][::-1], header, frameon=False)
pie_plot(self.fig,self.axes,data)
kwargs = dict(size=13, color=‘white’, va=‘center’, fontweight=‘bold’)
ax.text(0, 0, ‘Year 2005’, ha=‘center’,
bbox=dict(boxstyle=‘round’, facecolor=‘blue’, edgecolor=‘none’),
**kwargs)
ax.annotate(‘Year 2006’, (0, 0), xytext=(np.radians(-45), 1.1),
bbox=dict(boxstyle=‘round’, facecolor=‘green’, edgecolor=‘none’),
textcoords=‘polar’, ha=‘left’, **kwargs)
#ax.axes.plot()
def pie(ax, values, **kwargs):
total = sum(values)
def formatter(pct):
return ‘{:0.0f}\n{:0.1f}%’.format(pct*total/100,pct)
wedges, _, labels = ax.pie(values, autopct=formatter, **kwargs)
return wedges
#plt.show()
class myWidget(QtGui.QWidget, Ui_Form):
def init(self,parent=None):
QtGui.QWidget.init(self, parent)
self.setupUi(self)
self.pushButton.clicked.connect(self.draw)
def draw(self):
print ‘=’
sc = MyStaticMplCanvas(self.matwidget, width=2, height=3, dpi=100)
sc.show()
qApp = QtGui.QApplication(sys.argv)
aw = ApplicationWindow()
aw.setWindowTitle(“%s” % progname)
aw = myWidget()
aw.show()
sys.exit(qApp.exec_())
####################################