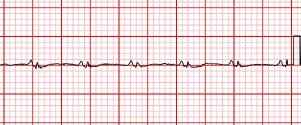
Kindly find the image attached with this mail. I want to make the graph with grid lines(shown in background) as plotted in attached mail(Dont consider the curve in foreground).How can we do it in matplotlib? I tried grid(color=’#f52887’, linestyle=’-’, linewidth=1). But I couldnt figure out how to go ahead.
Thanks in advance!
Regards
Yogesh
Try something like
minorticks_on()
grid(True, color="k", ls="solid")
grid(True, which="minor", color="r")
-JJ
···
On Wed, Mar 24, 2010 at 7:33 AM, yogesh karpate <yogeshkarpate@...287...> wrote:
Kindly find the image attached with this mail. I want to make the graph
with grid lines(shown in background) as plotted in attached mail(Dont
consider the curve in foreground).How can we do it in matplotlib? I tried
grid(color='#f52887', linestyle='-', linewidth=1). But I couldnt figure out
how to go ahead.
Thanks in advance!
Regards
Yogesh
------------------------------------------------------------------------------
Download Intel® Parallel Studio Eval
Try the new software tools for yourself. Speed compiling, find bugs
proactively, and fine-tune applications for parallel performance.
See why Intel Parallel Studio got high marks during beta.
http://p.sf.net/sfu/intel-sw-dev
_______________________________________________
Matplotlib-users mailing list
Matplotlib-users@lists.sourceforge.net
matplotlib-users List Signup and Options