Hey guys, does anyone know how to make one of the axis in the scatter plot shrinking like the x-axis in the following chart? Together with the grid?
Thank you very much!
Hey guys, does anyone know how to make one of the axis in the scatter plot shrinking like the x-axis in the following chart? Together with the grid?
Thank you very much!
What do you mean by shrinking?
Try semilogx or ax.set_xscale(‘log’)
Thanks. I tried the log-scale ax.set_xscale(‘log’) before, and the 10-power-n seems isometric.
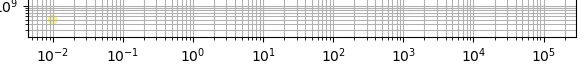
But I am looking for like the one more log-scale after the ax.set_xscale(‘log’), so the x-axis would be x_axis = log(log(x)).
Is it possible to do that? Thanks again.
Sure it’s possible. But the scale above is a log scale between 2 and 9
Sorry for the misleading chart above. For now I am looking for solely the log(log(x)) scale. Thank you very much.
Please have a look at funcscale: https://matplotlib.org/3.1.1/api/scale_api.html#matplotlib.scale.FuncScale