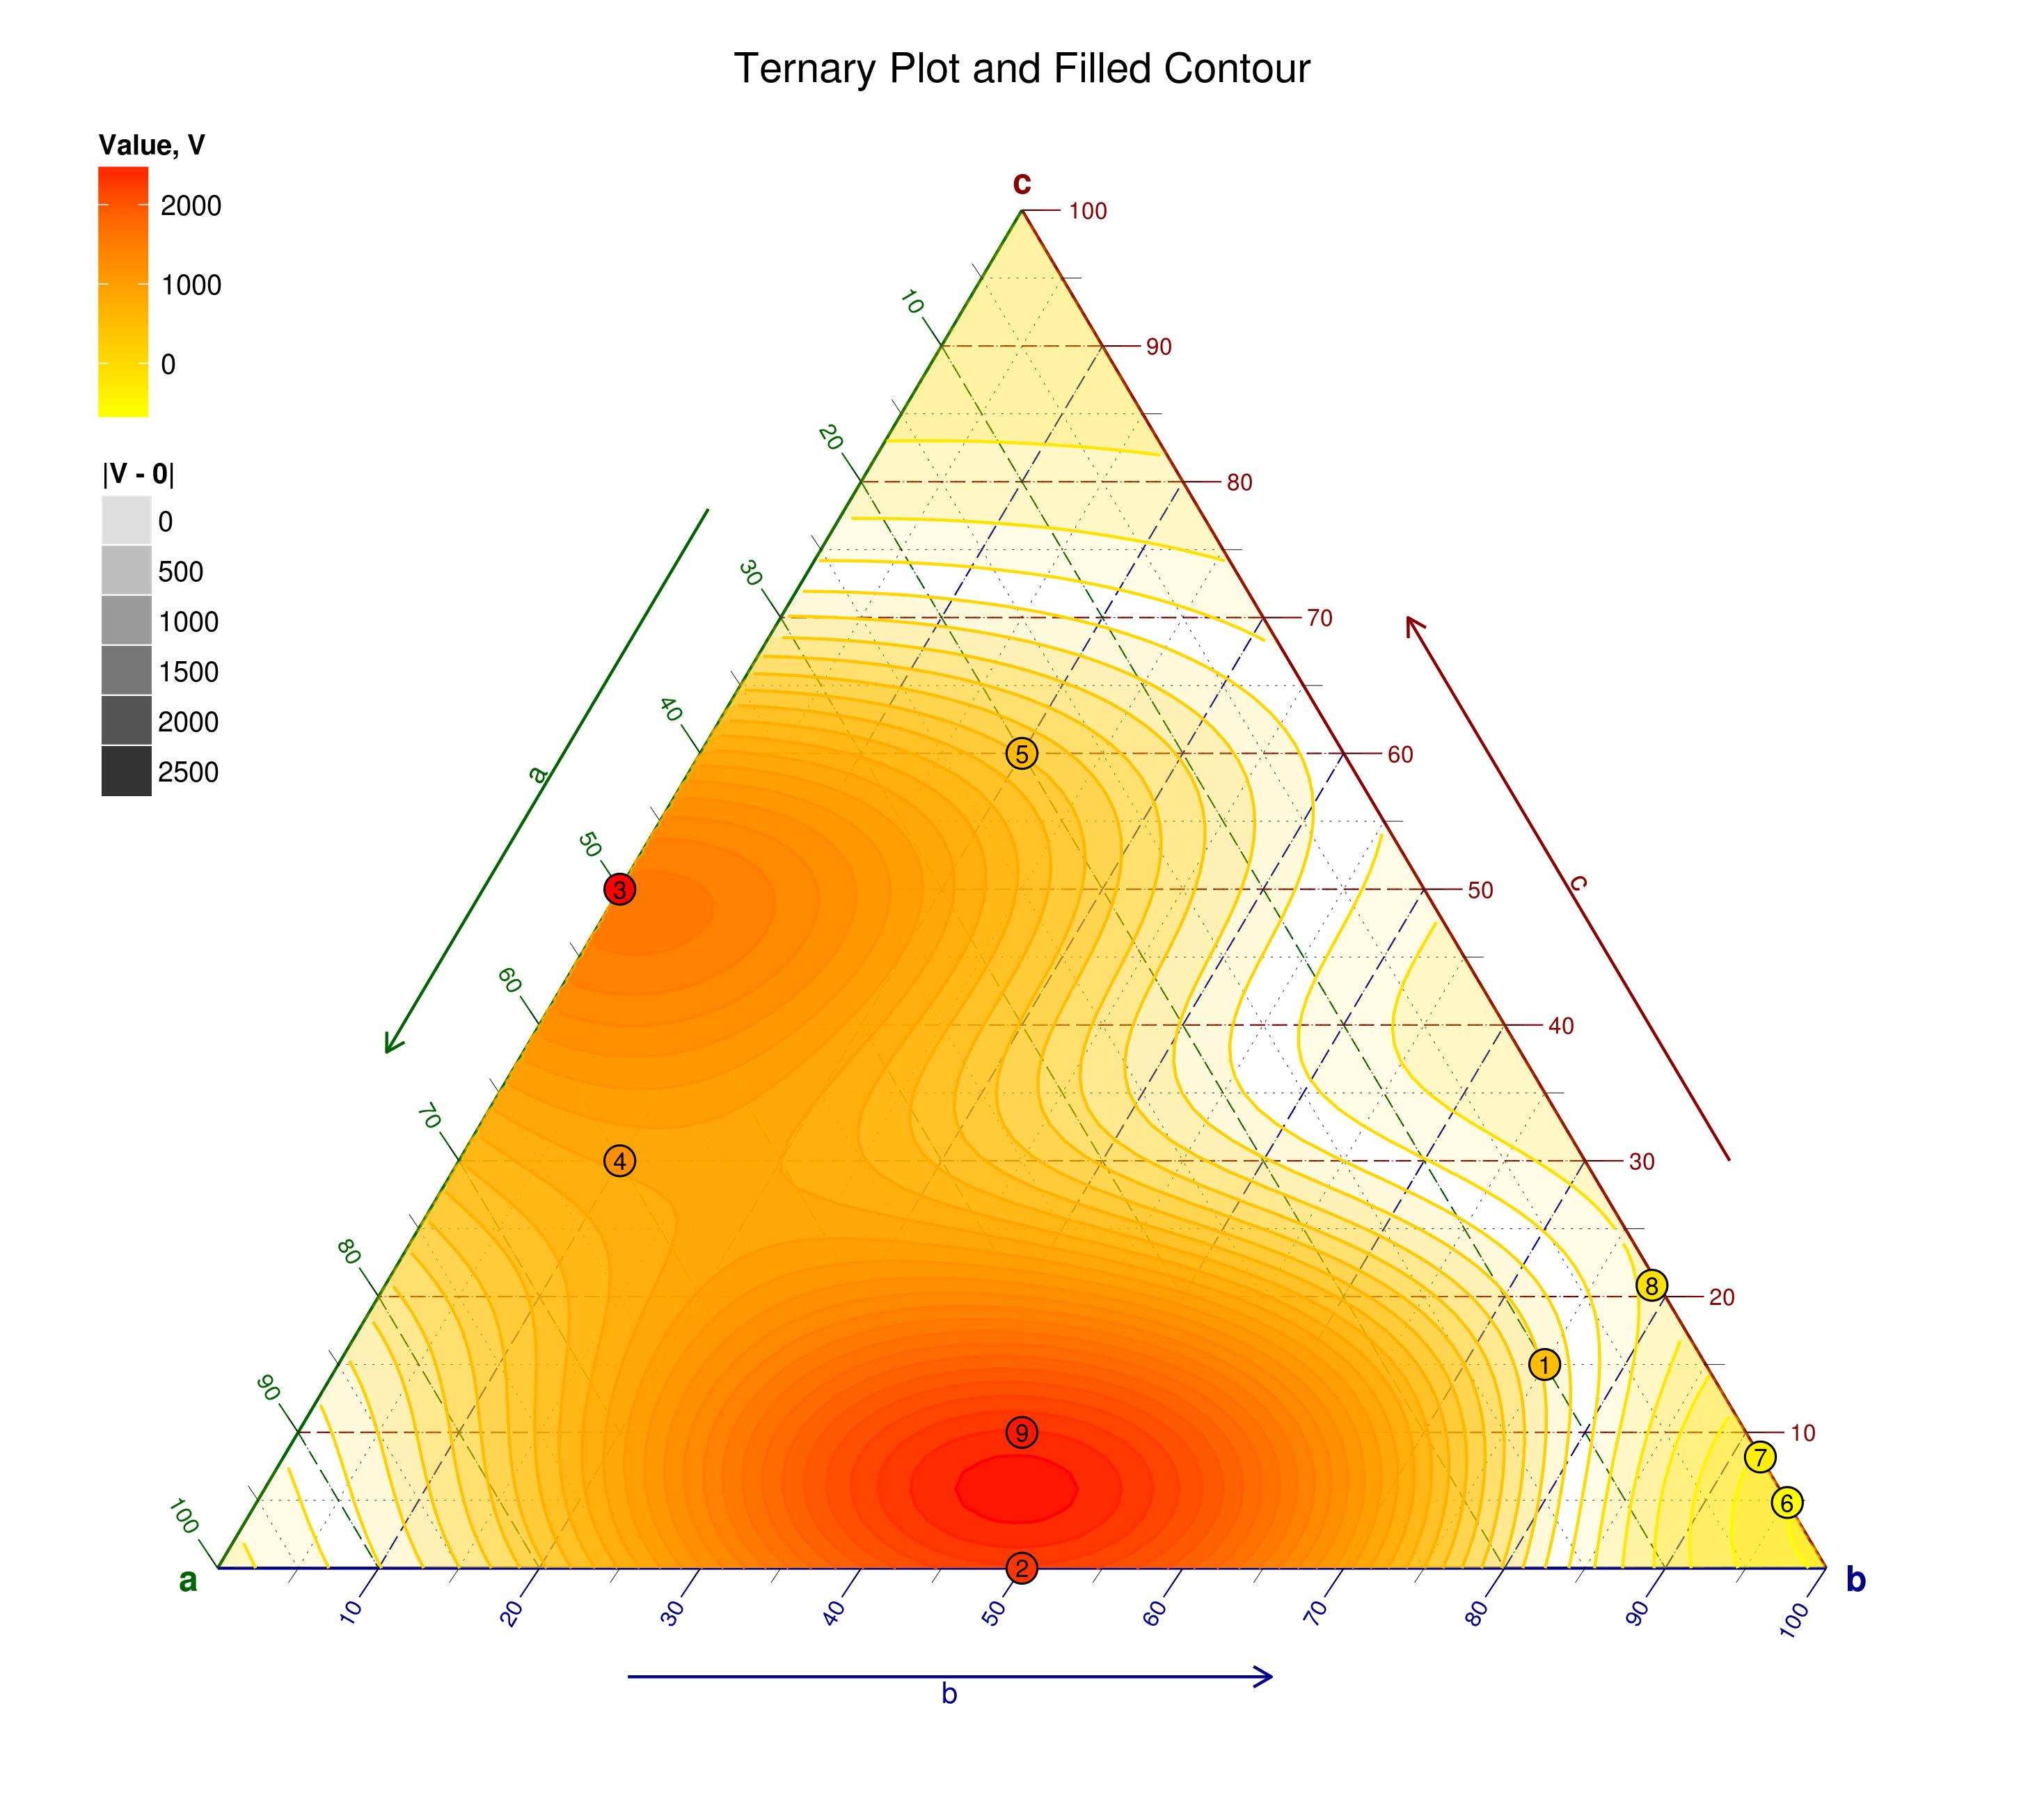
I am trying to create ternary plots with matplotlib as shown in the figure (source). The axes are A, B, C and D values should be denoted by contours and the points need to be labelled like in figure.
 Can such plots be created in matplotlib or with Python? This question is already posted on stackoverflow.
nxkr
We have a pr in to add ternary axes, but unfortunately I do not understand it well enough to tell you of contours will work.
See https://github.com/matplotlib/matplotlib/pull/3828 and links with in.
Tom
···
On Sat, Apr 11, 2015, 07:47 nxkryptor nxkr <nxkryptor@…287…> wrote:
I am trying to create ternary plots with matplotlib as shown in the figure (source). The axes are A, B, C and D values should be denoted by contours and the points need to be labelled like in figure.
Can such plots be created in matplotlib or with Python? This question is already posted on stackoverflow.
nxkr
BPM Camp - Free Virtual Workshop May 6th at 10am PDT/1PM EDT
Develop your own process in accordance with the BPMN 2 standard
Learn Process modeling best practices with Bonita BPM through live exercises
http://www.bonitasoft.com/be-part-of-it/events/bpm-camp-virtual- event?utm_
source=Sourceforge_BPM_Camp_5_6_15&utm_medium=email&utm_campaign=VA_SF_______________________________________________
Matplotlib-users mailing list
[email protected]
https://lists.sourceforge.net/lists/listinfo/matplotlib-users