Perfect. This works.
import random
import matplotlib.pyplot as plt
N = 10
x_vals = range(N)
bit_vals = [-1, 1]
my_bits =
for x in xrange(N):
my_bits.append(bit_vals[random.randint(0, 1)])
print my_bits
fig = plt.figure()
ax = fig.add_axes([0.1, 0.1, 0.8, 0.8])
ax.set_ylim(ymin=-2, ymax=2)
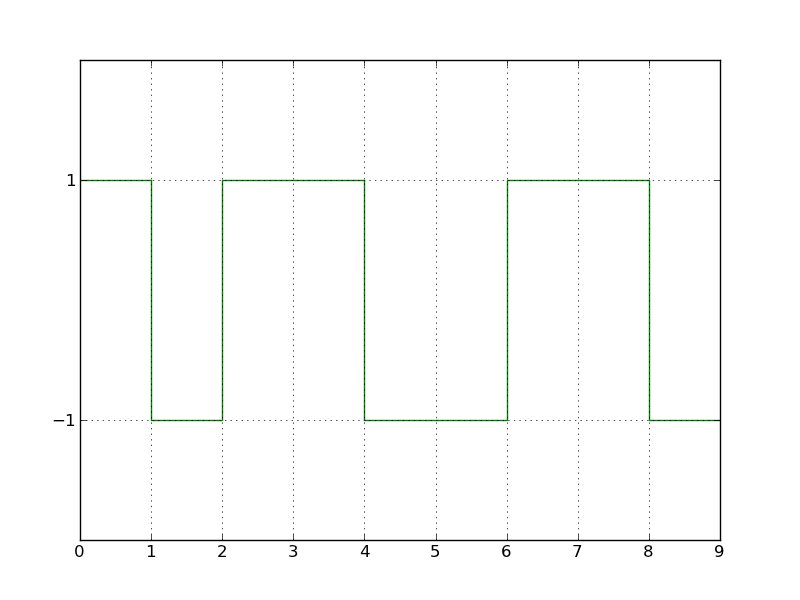
ax.step(x_vals, my_bits, color=‘g’)
ax.grid()
ax.set_yticks((-1, 1))
plt.show()
···
----- Original Message -----
From: sebastian
Sent: 08/02/11 11:51 AM
Subject: Re: [Matplotlib-users] How to create a square wave plot
Hi, On Tue, 02 Aug 2011 08:43:47 +0000, Freedom Fighter wrote: > Hi, > > what's the easiest method of creating a square wave plot? > Let's say I have a data stream of bits that have values of "1" or > "-1". > The plot function wants to draw a diagonal line between those points > but I need to have a horizontal line. So to get a "square wave" I > must > insert additional points to the series when the values change. > I wonder if there an easy way of doing this? You can use the "step" function, which does exactly this and has arguments for setting where the step is made, etc. Regards, Sebastian ------------------------------------------------------------------------------ BlackBerry® DevCon Americas, Oct. 18-20, San Francisco, CA The must-attend event for mobile developers. Connect with experts. Get tools for creating Super Apps. See the latest technologies. Sessions, hands-on labs, demos & much more. Register early & save! http://p.sf.net/sfu/rim-blackberry-1 _______________________________________________ Matplotlib-users mailing list [email protected] https://lists.sourceforge.net/lists/listinfo/matplotlib-users