Hi all,
I’m working on a little app that can
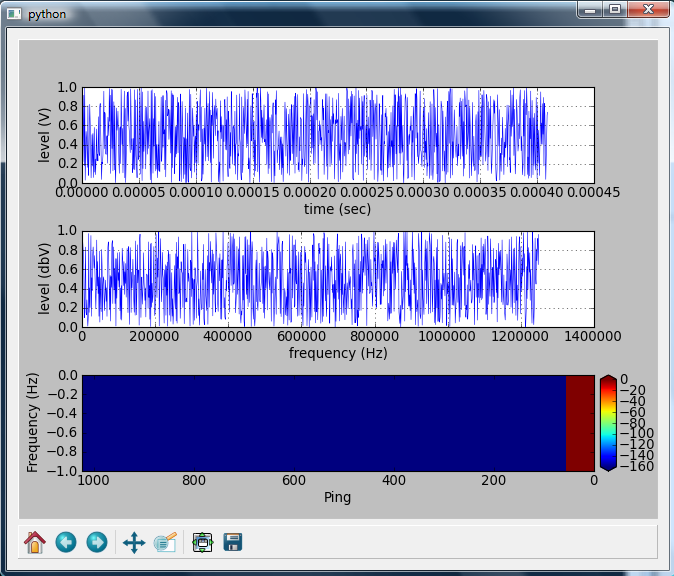
display time data, fft data + a trace of fft data (like a spectrogram).
For now performances are just OK so I was
looking for something that can improve the whole thing.
I’ve just discovered blitting
features of matplotlib, wow !
It seems that this is what was missing to
me J
Taking a look at this example http://matplotlib.sourceforge.net/examples/animation/animation_blit_qt4.html
I’ve understood that I can avoid redraw
the background each time using blitting, thus for my two first graph that change
every frame, I can blit the background and then draw the time and fft values.
This should improve performances a lot.
Am I true?
Now, assuming I’m true here is the
tricky question J
The third graph is an imshow with an array
of plot that is refreshed each frame. Basically each time I got a new FFT I
rotate the whole array of point from right to left and add a new line of data
into the array on the vertical line at the top right of the drawing.
Then I draw with imshow.
Not to say that it is ultra inefficient because:
1/I need to rotate the array that cost a
lot of time (I needed to limit the array to 256*1024) (downscaling y values to
match figure height)
2/the whole thing is redrawn entirely each
time.
Here is the function that rotate points (if
it could help you understand):
def setValue(self, value):
div = len(value)/self._height #we
compute how much we want to downscale Y
r = zeros((self._height,1))
#I
create an blank line
x = array(value)
#i
transform new values into a array
for i in xrange(self._height):
#downscaling algo
r[i,0] = x[divi:div(i+1)].max()
self._value = hstack([self._value[:,1:],r]) #and rotating the full
array, ouch!
self._cbar.set_array(self._value)
So, here is my question, should it be possible
thx to blitting feature:
1/first do a full drawing like today
2/each time I receive a new line of data:
- I want to blit
lines from x=(1 to xmax) into x=(0 to xmax-1)

···
Only draw the new line of data at position xmax (using imshow coloring…)
Can you help me giving me some directions?
(if this kind of thing is possible…)
Cheers,
Laurent