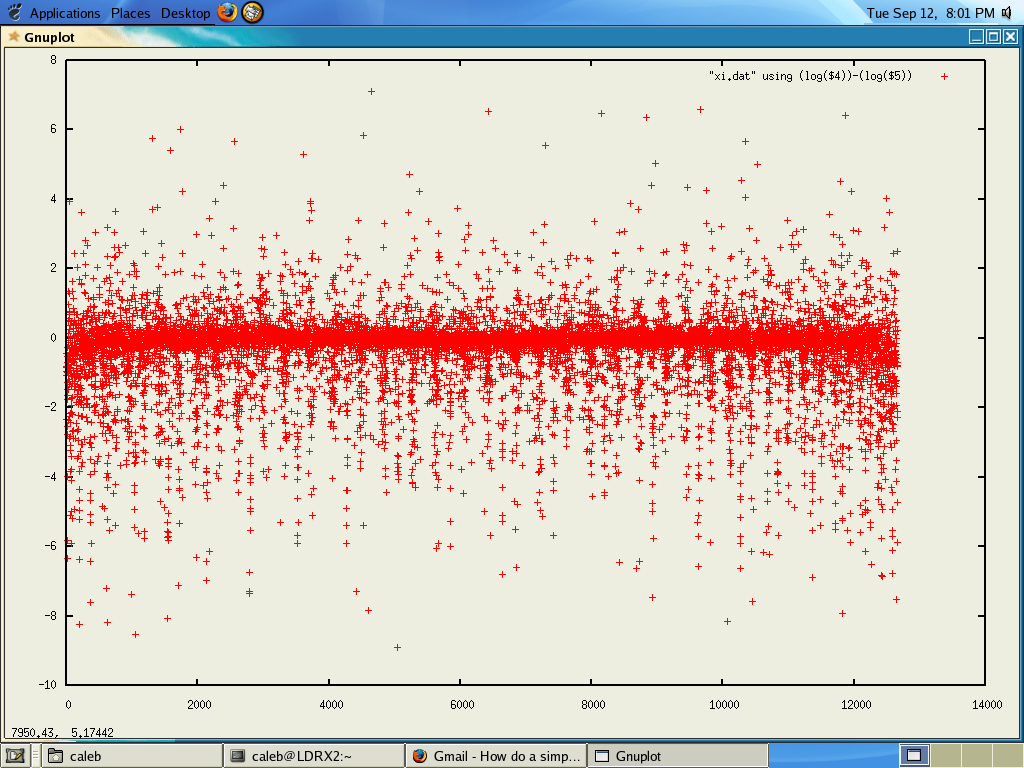
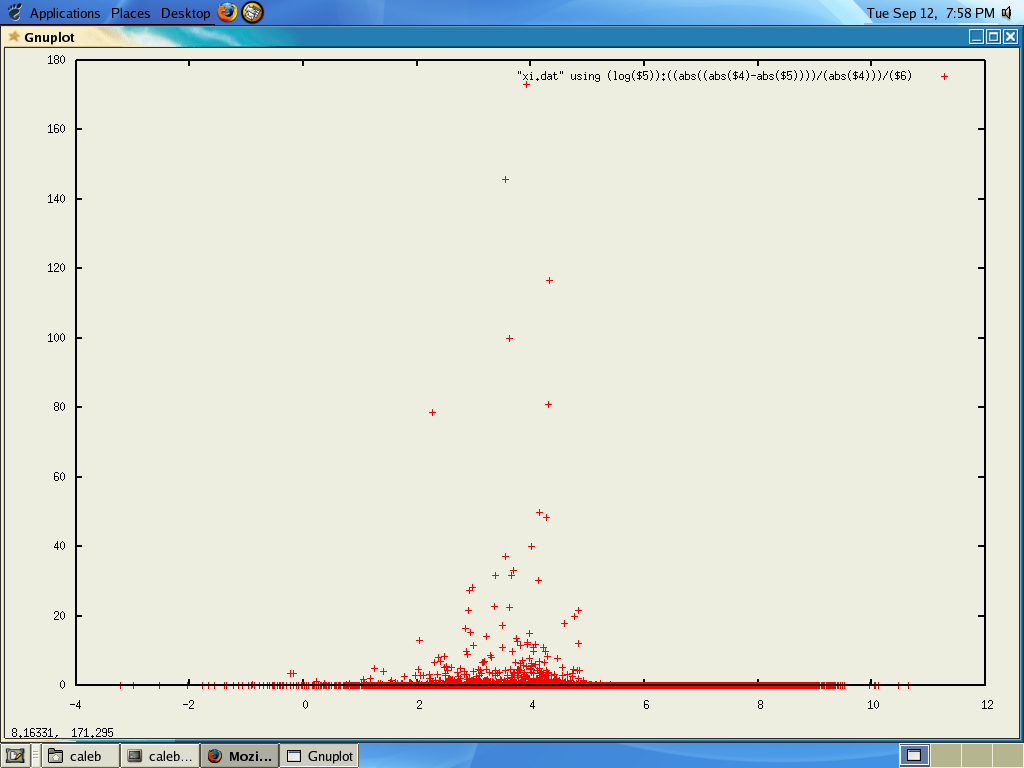
its this tipe of grafics I want see anexed img
grafics of experimental poits, tehrtea are a way to do it in mathplot?
2006/9/12, David Chin <david.w.h.chin@…287…>:
···
On 9/11/06, Esdras Caleb <acheicaleb@…287…> wrote:
No I dont want unconected dots, I want my poits not a line, the poits are
experimental they dont follow a line, i want see what is the too far poitsand cut it of my file. I can draw oly the points and not a poits of line but
the poits of file?you mentioned in an earlier message that gnuplot produced the output
you desired. can you show that plot? it would help me understand whatyou are going for.
– dave
Email: david.w.h.chin@…287…
Public key: http://gallatin.physics.lsa.umich.edu/~dwchin/crypto.html
pub 1024D/1C557DDF 2006-07-21 [expires: 2007-07-21]
Key fingerprint = 4EEB A409 5010 3679 4EA7 D420 4E52 202A 1C55 7DDF