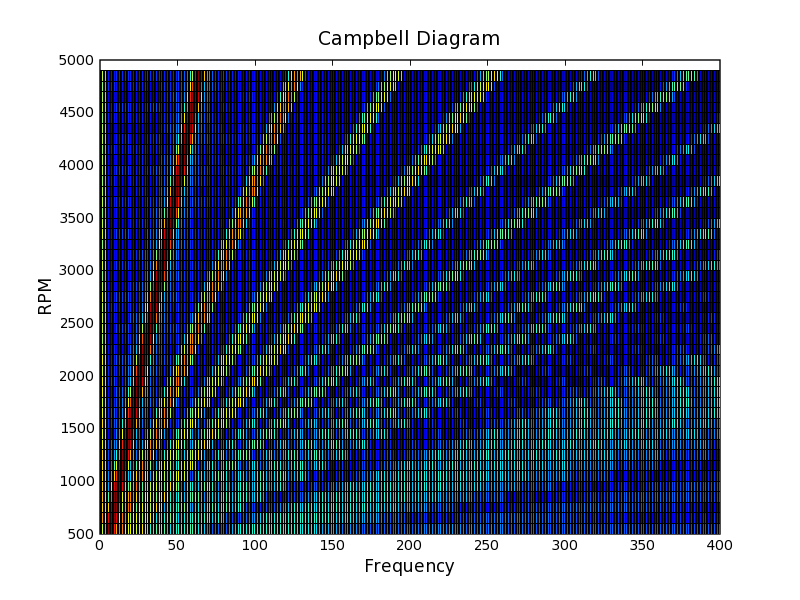
I have lots of rectangles of different colors which
Matplotlib created wonderfully which was exactly
what I was trying to do.
(I have 400 rectangles across the plot in horizontal
direction.)
It appears there are small black borders (padding?) to all little
colored rectangles that make the plot appear more
choppy and less 'blended' in color than I would prefer.
It may be that I *must* have more rectangles to make
these black borders be invisible.
I was wondering if there is any way I can remove
thin black lines (borders) in this plot for cases
like this where I don't have zillions of rectangles
to make black lines too small to notice.
Chris
···
--
_______________________________________
Christian Seberino, Ph.D.
SPAWAR Systems Center San Diego
Code 2872
49258 Mills Street, Room 158
San Diego, CA 92152-5385
U.S.A.
I was wondering if there is any way I can remove
thin black lines (borders) in this plot for cases
like this where I don't have zillions of rectangles
to make black lines too small to notice.
Does the docstring for pcolor help?
* shading = 'flat' : or 'faceted'. If 'faceted', a black grid is
drawn around each rectangle; if 'flat', edge colors are same as
face colors
On Thu, Dec 23, 2004 at 11:00:41PM -0800, Andrew Straw wrote:
seberino@...391... wrote:
>Attached is a pcolor plot made with Matplotlib.
>
>I was wondering if there is any way I can remove
>thin black lines (borders) in this plot for cases
>like this where I don't have zillions of rectangles
>to make black lines too small to notice.
>
>
>
Does the docstring for pcolor help?
* shading = 'flat' : or 'faceted'. If 'faceted', a black grid is
drawn around each rectangle; if 'flat', edge colors are same as
face colors
Try
pcolor( your_other_args, shading='flat')
Cheers!
Andrew
--
_______________________________________
Christian Seberino, Ph.D.
SPAWAR Systems Center San Diego
Code 2872
49258 Mills Street, Room 158
San Diego, CA 92152-5385
U.S.A.