Hello matplotlib developers,
I’m not sure if this is the right mailing list for this question, so please re-direct me if it is not.
I am wondering whether it is possible to have a histogram in pyplot normalized to the total length of the list input, rather than just the bins showing on the plot (i.e. include those entries in the “overflow” and “underflow”, off the right and left edges of the plot). As far as I can tell, the normed option of pyplot.hist currently makes it so that the area under the bins showing is 1. This can lead to a situation like the one pasted below, where when I look at the whole histogram the bins have certain values but when I try to zoom in to see one part of the plot better those values change.
I can think of two ways to solve this as of now:
-
Use the weights option to scale each entry by 1/len(input) rather than using normed=True.
-
Somehow add the contents of the overflow to the last bin of the plot, which would keep the normalizations constant for earlier bins even if you extend the axes.
Is there a better way of doing this? If the option does not currently exist, I am also happy to help implement it if the community would find it desirable.
Thanks for your help!
Tomo Lazovich
P.S. Here is a toy example of what I mean:
import numpy as np
import matplotlib.pyplot as plt
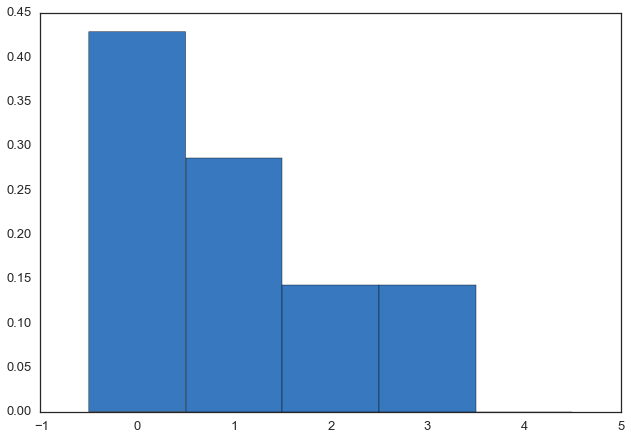
h1 = [0, 0, 0, 1, 1, 2, 3]
my_bins = np.linspace(-0.5, 4.5, 6)
plt.hist(h1, bins=my_bins, normed=True)
plt.show()
gives
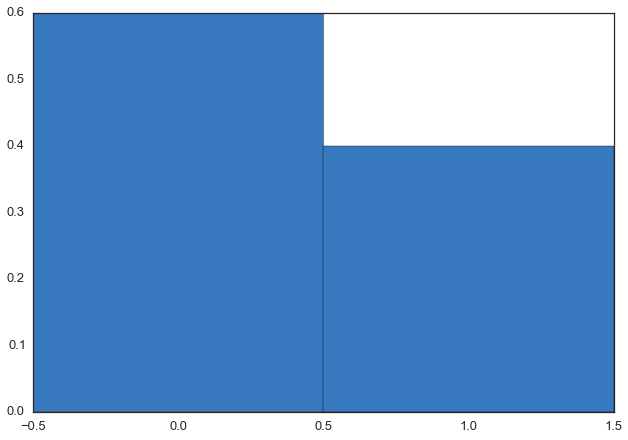
Now, if I change the range on the x axis that I would like plot:
my_bins2 = np.linspace(-0.5, 1.5, 3)
plt.hist(h1, bins=my_bins2, normed=True)
plt.show()
The y values have changed to 0.6 and 0.4 because the normalization does not include the values that are cut off to the right of the plot.
IMO, this seems like a bug. I would expect bars to change height with zoom/limit levels.
-p
···
—
Sent from Mailbox
On Sat, Mar 7, 2015 at 4:20 PM, Tomo Lazovich <lazovich@…149…> wrote:
Hello matplotlib developers,
I’m not sure if this is the right mailing list for this question, so please re-direct me if it is not.
I am wondering whether it is possible to have a histogram in pyplot normalized to the total length of the list input, rather than just the bins showing on the plot (i.e. include those entries in the “overflow” and “underflow”, off the right and left edges of the plot). As far as I can tell, the normed option of pyplot.hist currently makes it so that the area under the bins showing is 1. This can lead to a situation like the one pasted below, where when I look at the whole histogram the bins have certain values but when I try to zoom in to see one part of the plot better those values change.
I can think of two ways to solve this as of now:
- Use the weights option to scale each entry by 1/len(input) rather than using normed=True.
- Somehow add the contents of the overflow to the last bin of the plot, which would keep the normalizations constant for earlier bins even if you extend the axes.
Is there a better way of doing this? If the option does not currently exist, I am also happy to help implement it if the community would find it desirable.
Thanks for your help!
Tomo Lazovich
P.S. Here is a toy example of what I mean:
import numpy as np
import matplotlib.pyplot as plt
h1 = [0, 0, 0, 1, 1, 2, 3]
my_bins = np.linspace(-0.5, 4.5, 6)
plt.hist(h1, bins=my_bins, normed=True)
plt.show()
gives
<image.png>
Now, if I change the range on the x axis that I would like plot:
my_bins2 = np.linspace(-0.5, 1.5, 3)
plt.hist(h1, bins=my_bins2, normed=True)
plt.show()
<image.png>
The y values have changed to 0.6 and 0.4 because the normalization does not include the values that are cut off to the right of the plot.
Paul,
Note that by zoom the op means they are changing the bins, not actual zooming(by just changing the x axis).
I was going to say we deal with normalization by delegating to numpy, but we actually handle it internally (with a note that when we drop np 1.5 to make numpy do it).
I think the best course of action here is to do that conversion and forward this feature request to numpy (if it does not already do this).
Tom
···
On Sat, Mar 7, 2015, 18:29 Paul Hobson <pmhobson@…149…> wrote:
IMO, this seems like a bug. I would expect bars to change height with zoom/limit levels.
-p
—
Sent from Mailbox
On Sat, Mar 7, 2015 at 4:20 PM, Tomo Lazovich <lazovich@…149…> wrote:
Hello matplotlib developers,
I’m not sure if this is the right mailing list for this question, so please re-direct me if it is not.
I am wondering whether it is possible to have a histogram in pyplot normalized to the total length of the list input, rather than just the bins showing on the plot (i.e. include those entries in the “overflow” and “underflow”, off the right and left edges of the plot). As far as I can tell, the normed option of pyplot.hist currently makes it so that the area under the bins showing is 1. This can lead to a situation like the one pasted below, where when I look at the whole histogram the bins have certain values but when I try to zoom in to see one part of the plot better those values change.
I can think of two ways to solve this as of now:
- Use the weights option to scale each entry by 1/len(input) rather than using normed=True.
- Somehow add the contents of the overflow to the last bin of the plot, which would keep the normalizations constant for earlier bins even if you extend the axes.
Is there a better way of doing this? If the option does not currently exist, I am also happy to help implement it if the community would find it desirable.
Thanks for your help!
Tomo Lazovich
P.S. Here is a toy example of what I mean:
import numpy as np
import matplotlib.pyplot as plt
h1 = [0, 0, 0, 1, 1, 2, 3]
my_bins = np.linspace(-0.5, 4.5, 6)
plt.hist(h1, bins=my_bins, normed=True)
plt.show()
gives
<image.png>
Now, if I change the range on the x axis that I would like plot:
my_bins2 = np.linspace(-0.5, 1.5, 3)
plt.hist(h1, bins=my_bins2, normed=True)
plt.show()
<image.png>
The y values have changed to 0.6 and 0.4 because the normalization does not include the values that are cut off to the right of the plot.
Dive into the World of Parallel Programming The Go Parallel Website, sponsored
by Intel and developed in partnership with Slashdot Media, is your hub for all
things parallel software development, from weekly thought leadership blogs to
news, videos, case studies, tutorials and more. Take a look and join the
conversation now. http://goparallel.sourceforge.net/_______________________________________________
Matplotlib-devel mailing list
Matplotlib-devel@…1041…sourceforge.net
https://lists.sourceforge.net/lists/listinfo/matplotlib-devel
Thanks for the suggestion…I will see how numpy handles this.
Sorry for not being clearer earlier. Tom is right that by “zooming” I meant changing the bins so that they covered a smaller range. Is there a better way of “zooming” in on an axis so that I don’t have this issue?
Thanks!
Tomo
···
On Sat, Mar 7, 2015 at 7:39 PM, Thomas Caswell <tcaswell@…149…> wrote:
Paul,
Note that by zoom the op means they are changing the bins, not actual zooming(by just changing the x axis).
I was going to say we deal with normalization by delegating to numpy, but we actually handle it internally (with a note that when we drop np 1.5 to make numpy do it).
I think the best course of action here is to do that conversion and forward this feature request to numpy (if it does not already do this).
Tom
On Sat, Mar 7, 2015, 18:29 Paul Hobson <pmhobson@…149…> wrote:
IMO, this seems like a bug. I would expect bars to change height with zoom/limit levels.
-p
—
Sent from Mailbox
On Sat, Mar 7, 2015 at 4:20 PM, Tomo Lazovich <lazovich@…149…> wrote:
Hello matplotlib developers,
I’m not sure if this is the right mailing list for this question, so please re-direct me if it is not.
I am wondering whether it is possible to have a histogram in pyplot normalized to the total length of the list input, rather than just the bins showing on the plot (i.e. include those entries in the “overflow” and “underflow”, off the right and left edges of the plot). As far as I can tell, the normed option of pyplot.hist currently makes it so that the area under the bins showing is 1. This can lead to a situation like the one pasted below, where when I look at the whole histogram the bins have certain values but when I try to zoom in to see one part of the plot better those values change.
I can think of two ways to solve this as of now:
- Use the weights option to scale each entry by 1/len(input) rather than using normed=True.
- Somehow add the contents of the overflow to the last bin of the plot, which would keep the normalizations constant for earlier bins even if you extend the axes.
Is there a better way of doing this? If the option does not currently exist, I am also happy to help implement it if the community would find it desirable.
Thanks for your help!
Tomo Lazovich
P.S. Here is a toy example of what I mean:
import numpy as np
import matplotlib.pyplot as plt
h1 = [0, 0, 0, 1, 1, 2, 3]
my_bins = np.linspace(-0.5, 4.5, 6)
plt.hist(h1, bins=my_bins, normed=True)
plt.show()
gives
<image.png>
Now, if I change the range on the x axis that I would like plot:
my_bins2 = np.linspace(-0.5, 1.5, 3)
plt.hist(h1, bins=my_bins2, normed=True)
plt.show()
<image.png>
The y values have changed to 0.6 and 0.4 because the normalization does not include the values that are cut off to the right of the plot.
Dive into the World of Parallel Programming The Go Parallel Website, sponsored
by Intel and developed in partnership with Slashdot Media, is your hub for all
things parallel software development, from weekly thought leadership blogs to
news, videos, case studies, tutorials and more. Take a look and join the
conversation now. http://goparallel.sourceforge.net/_______________________________________________
Matplotlib-devel mailing list
Matplotlib-devel@…1041…sourceforge.net
https://lists.sourceforge.net/lists/listinfo/matplotlib-devel
Sorry for the spam, but I just wanted to say that I now understand that I should be using plt.xlim to zoom in on the x-axis rather than changing the bins. When I zoom in with that, the bin height is indeed constant as expected.
···
On Sat, Mar 7, 2015 at 8:00 PM, Tomo Lazovich <lazovich@…149…> wrote:
Thanks for the suggestion…I will see how numpy handles this.
Sorry for not being clearer earlier. Tom is right that by “zooming” I meant changing the bins so that they covered a smaller range. Is there a better way of “zooming” in on an axis so that I don’t have this issue?
Thanks!
Tomo
On Sat, Mar 7, 2015 at 7:39 PM, Thomas Caswell <tcaswell@…149…> wrote:
Paul,
Note that by zoom the op means they are changing the bins, not actual zooming(by just changing the x axis).
I was going to say we deal with normalization by delegating to numpy, but we actually handle it internally (with a note that when we drop np 1.5 to make numpy do it).
I think the best course of action here is to do that conversion and forward this feature request to numpy (if it does not already do this).
Tom
On Sat, Mar 7, 2015, 18:29 Paul Hobson <pmhobson@…149…> wrote:
IMO, this seems like a bug. I would expect bars to change height with zoom/limit levels.
-p
—
Sent from Mailbox
On Sat, Mar 7, 2015 at 4:20 PM, Tomo Lazovich <lazovich@…149…> wrote:
Hello matplotlib developers,
I’m not sure if this is the right mailing list for this question, so please re-direct me if it is not.
I am wondering whether it is possible to have a histogram in pyplot normalized to the total length of the list input, rather than just the bins showing on the plot (i.e. include those entries in the “overflow” and “underflow”, off the right and left edges of the plot). As far as I can tell, the normed option of pyplot.hist currently makes it so that the area under the bins showing is 1. This can lead to a situation like the one pasted below, where when I look at the whole histogram the bins have certain values but when I try to zoom in to see one part of the plot better those values change.
I can think of two ways to solve this as of now:
- Use the weights option to scale each entry by 1/len(input) rather than using normed=True.
- Somehow add the contents of the overflow to the last bin of the plot, which would keep the normalizations constant for earlier bins even if you extend the axes.
Is there a better way of doing this? If the option does not currently exist, I am also happy to help implement it if the community would find it desirable.
Thanks for your help!
Tomo Lazovich
P.S. Here is a toy example of what I mean:
import numpy as np
import matplotlib.pyplot as plt
h1 = [0, 0, 0, 1, 1, 2, 3]
my_bins = np.linspace(-0.5, 4.5, 6)
plt.hist(h1, bins=my_bins, normed=True)
plt.show()
gives
<image.png>
Now, if I change the range on the x axis that I would like plot:
my_bins2 = np.linspace(-0.5, 1.5, 3)
plt.hist(h1, bins=my_bins2, normed=True)
plt.show()
<image.png>
The y values have changed to 0.6 and 0.4 because the normalization does not include the values that are cut off to the right of the plot.
Dive into the World of Parallel Programming The Go Parallel Website, sponsored
by Intel and developed in partnership with Slashdot Media, is your hub for all
things parallel software development, from weekly thought leadership blogs to
news, videos, case studies, tutorials and more. Take a look and join the
conversation now. http://goparallel.sourceforge.net/_______________________________________________
Matplotlib-devel mailing list
Matplotlib-devel@…1041…sourceforge.net
https://lists.sourceforge.net/lists/listinfo/matplotlib-devel
Tom, ``When we drop numpy 1.5''? I thought we already had... I mean we only test numpy 1.6 on Travis...
For the rebinning exercise, I don't have time to look, but I would expect a similar trick to imshow, quiver, etcetera when I want to compare to a baseline (e.g. for animation). Namely I calculate the normalisation parameters first, and then apply those parameters on subsequent plots.
To ease the user, we could add a method to return the binning parameters from a single binning exercise, and then give an option to pass those params in to subsequent plots.