Hello,
I am looking for a way to hide tick marks (not the labels!) that coincide with axis lines. I think this is a problem for me because of the relative line thicknesses of my axis lines and tick marks, but I want to leave those thicknesses unchanged (I like the look of the thickness settings I am using now).
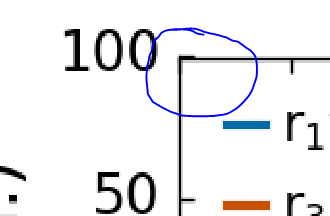
Here is a screenshot of what I’m talking about:
I know this looks minor, but it is quite obvious on some plots and I’d really like to get rid of it.
Thanks,
Julian Irwin
Try this:
from matplotlib import pyplot as plt
fig = plt.figure()
ax = fig.add_subplot(1, 1, 1)
ax.plot([0, 1], [0, 1])
print(ax.get_xticks())
ax.set_xticks(ax.get_xticks()[1:-1]) # Remove first and last ticks
print(ax.get_xticks())
···
On 28 January 2016 at 19:49, Julian Irwin <[email protected]...> wrote:
I am looking for a way to hide tick marks (not the labels!) that coincide with axis lines. I think this is a problem for me because of the relative line thicknesses of my axis lines and tick marks, but I want to leave those thicknesses unchanged (I like the look of the thickness settings I am using now).
--
Oscar
Thanks for your suggestion Oscar. I tried editing the ticks like this, but this method removes both the tick marks and the labels.
I think I have found a decent solution. Unfortunately my solution required a very particular order of operations. It is much less convenient than the functions provided in the API like tick_params(), which don’t care if you have run plt.draw() ahead of time…
-
Run all of the setup for the plot and also the plotting commands (ax.plot(), ax.hist()…whatever)
-
Run plt.draw() because this updates the tick objects contained in your axes.
-
Grab your Tick objects: ticks = ax.[x/y]axis.[major/minor]Ticks
-
For each tick you want to hide do:
tick.tick1On = False
tick.tick2On = False
The 1 and 2 refer to the bottom, top (left, right) for the x (y) axis respectively.
- Run plt.show(), fig.show() or fig.savefig or whatever else you are using.
Ahhhhh, no messy ticks in the corner!
Julian
···
On Fri, Jan 29, 2016 at 10:49 AM, Oscar Benjamin <oscar.j.benjamin@…287…> wrote:
On 28 January 2016 at 19:49, Julian Irwin <julian.irwin@…985…> wrote:
I am looking for a way to hide tick marks (not the labels!) that coincide with axis lines. I think this is a problem for me because of the relative line thicknesses of my axis lines and tick marks, but I want to leave those thicknesses unchanged (I like the look of the thickness settings I am using now).
Try this:
from matplotlib import pyplot as plt
fig = plt.figure()
ax = fig.add_subplot(1, 1, 1)
ax.plot([0, 1], [0, 1])
print(ax.get_xticks())
ax.set_xticks(ax.get_xticks()[1:-1]) # Remove first and last ticks
print(ax.get_xticks())
–
Oscar