Help with drawing polygons with holes in them

Hi folks!

I’m looking for some help developing napari. We’re having an issue with displaying polygons with holes in them, which matplotlib handles just fine. I tried to step through the matplotlib code for drawing a filled polygon but got lost rather quickly. :sweat_smile: I’m hoping someone here can point me to the algorithm that matplotlib uses to draw these, so we can reuse it in napari.

Polygons with holes seem to commonly be represented in map data as a single polygon with a back-and-forth edge from the external contour to the internal contour, where the internal contour uses the opposite winding direction to the outer contour. You can find the polygon from the full example in this gist, but everything works with a toy example so I’ll use that below.

Here’s a minimum reproducible example:

import matplotlib.pyplot as plt
import numpy as np

embedded = np.array(
        [[  0,   0],  # outer triangle 0
         [  0, 100],  # outer triangle 1 (clockwise)
         [100,  50],  # outer triangle 2
         [ 50,  30],  # go to inner triangle 0
         [ 50,  70],  # inner triangle 1
         [ 20,  50],  # inner triangle 2  (counterclockwise)
         [ 50,  30],  # back to inner triangle 0
         [100,  50]]  # back to outer triangle 2
        )  # final edge to outer triangle 0 implicit

fig, ax = plt.subplots()
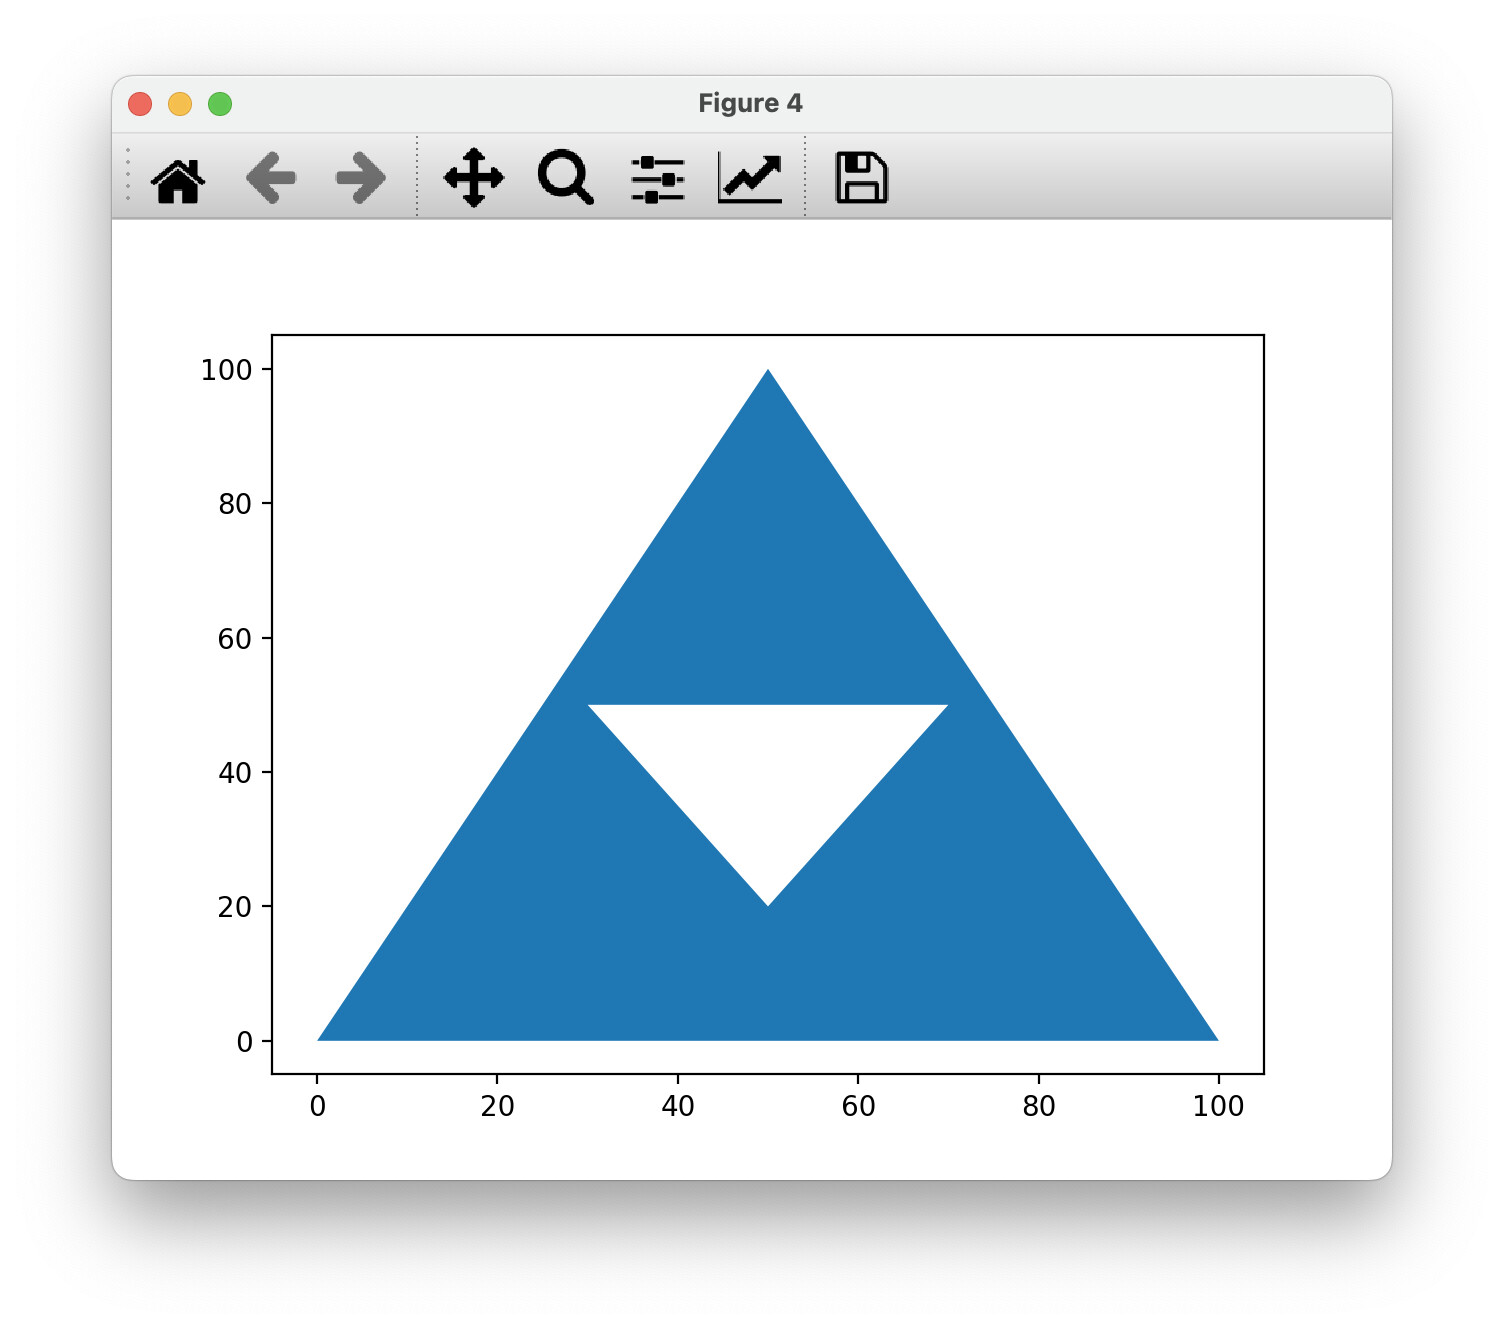
ax.fill(embedded[:, 1], embedded[:, 0])
plt.show()

This results in:

Compare that with napari’s output (you can install napari with pip install napari[pyqt]):

import napari

viewer = napari.Viewer()
viewer.add_shapes(embedded, shape_type='polygon')

napari.run()  # not needed in IPython

As you can see we have some catching up to do… :sweat_smile:

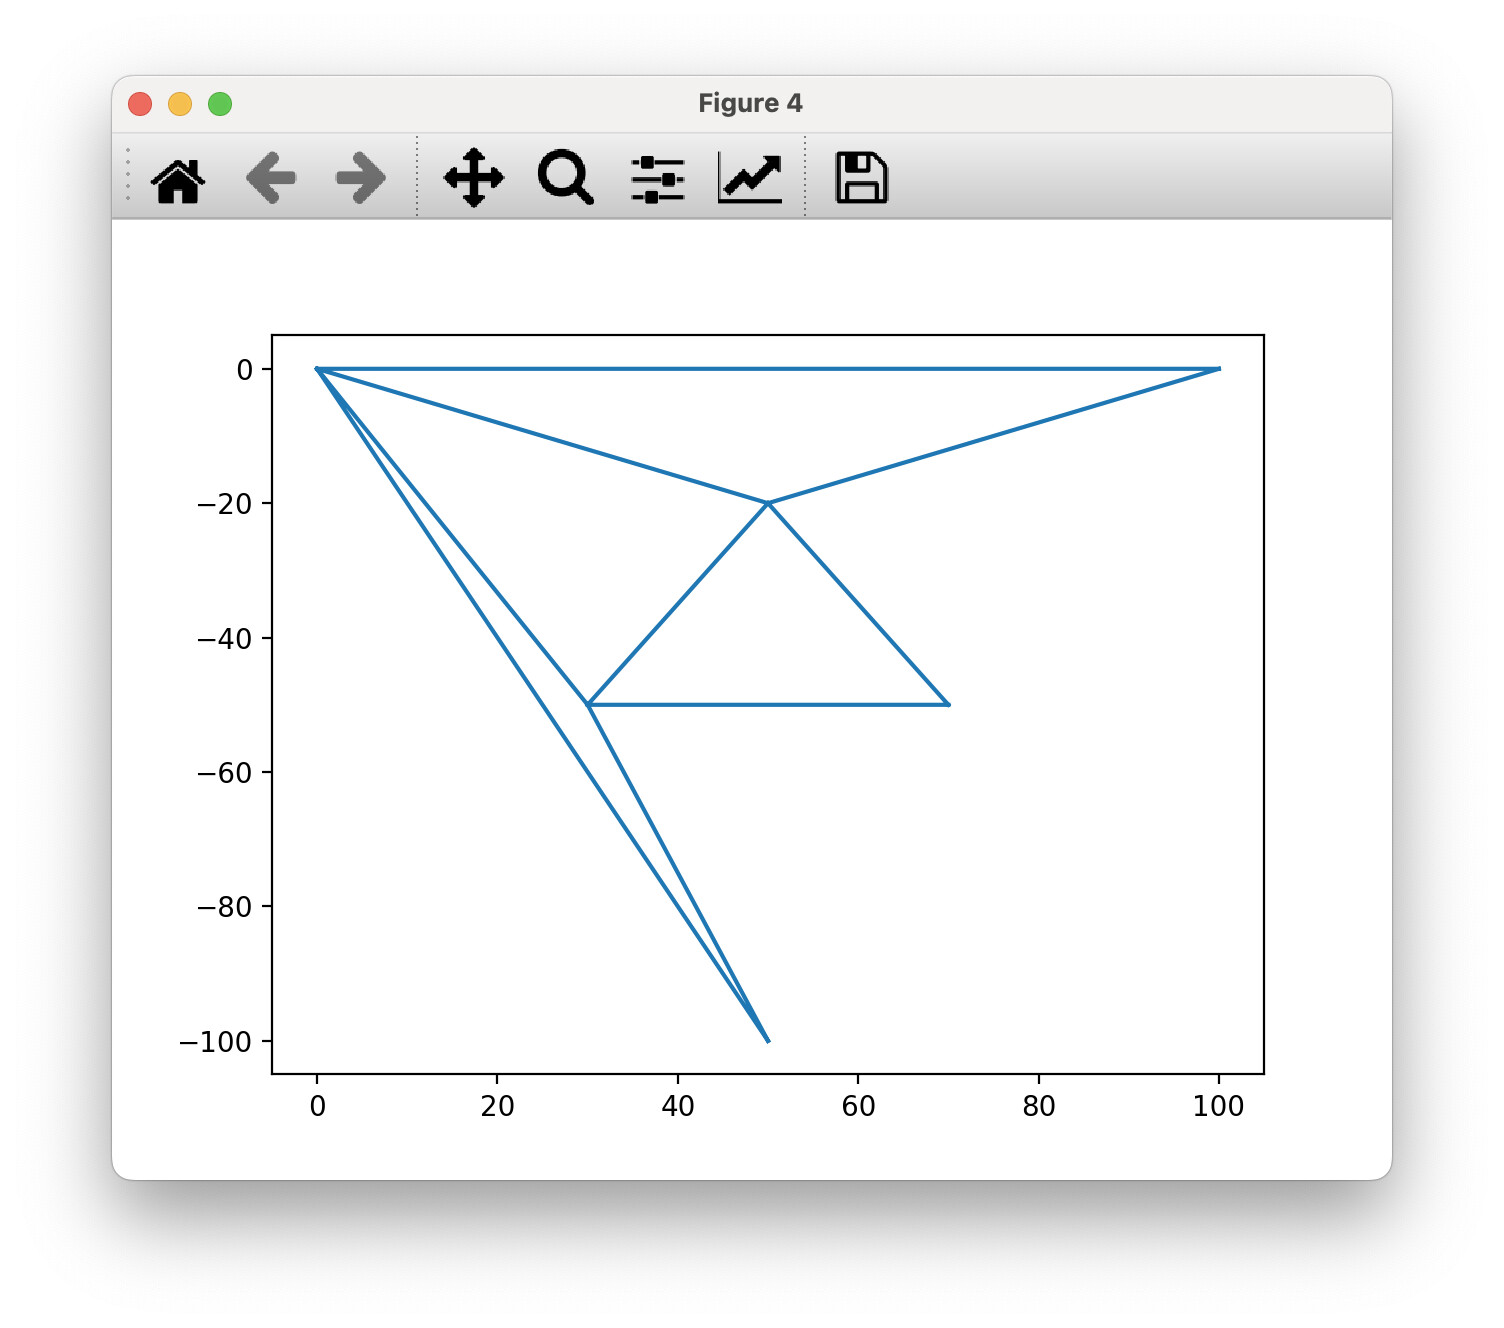
On the napari side, what we are doing is passing the data to VisPy’s PolygonData(), using its triangulate() method (actually implemented here), then adding those triangles to a mesh.

Thanks to Matplotlib’s triangulation plots, it’s easy to see how it’s going wrong:

from vispy.geometry.polygon import PolygonData
vertices, triangles = PolygonData(vertices=embedded).triangulate()
fig, ax = plt.subplots()
# note: I invert y to match napari which uses row/column coordinates
ax.triplot(vertices[:, 1], -vertices[:, 0], triangles)

So, my questions:

  • is there code deep in Matplotlib’s bowels that would give me the correct triangulation of my polygon-with-a-hole?
  • if so, where?
  • if not, how is matplotlib actually drawing this data?
  • also if not, can people point me to strategies, and ideally implementations, for the correct triangulation of such polygon data? My current naive/brute-force idea:
    • get the Delaunay triangulation of the points using scipy.spatial.Delaunay (which includes triangles both inside and outside of the polygon, see below)
    • find the center of each triangle
    • use skimage.measure.points_in_poly to determine whether it is inside the polygon
    • keep and draw only those triangles for which the center is in the polygon

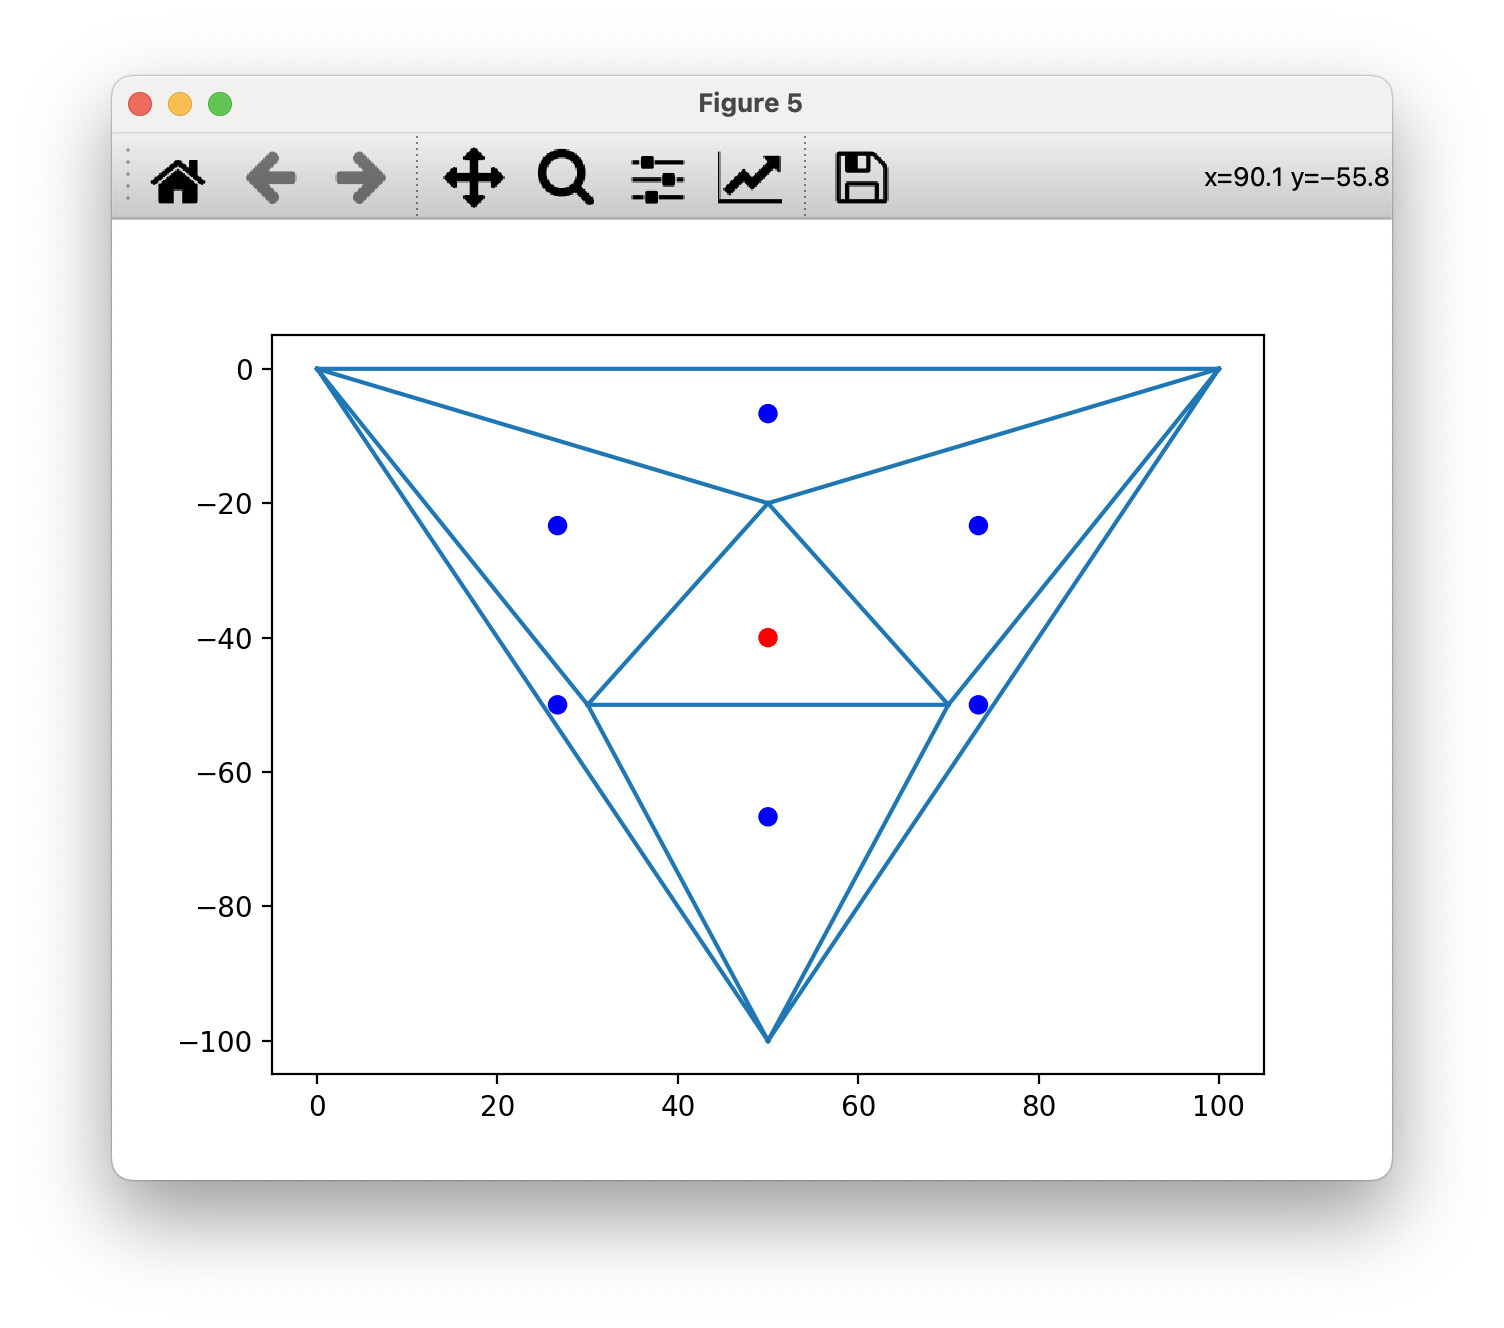
Here’s the Delaunay triangulation from that polygon data, with centers colored by points_in_poly:

from scipy.spatial import Delaunay
from skimage.measure import points_in_poly

delaunay = Delaunay(embedded)
centers = np.mean(embedded[delaunay.simplices], axis=1)
in_poly = points_in_poly(centers, embedded)
fig, ax = plt.subplots()
ax.triplot(embedded[:, 1], -embedded[:, 0], delaunay.simplices)
ax.scatter(
        centers[:, 1], -centers[:, 0],
        color=np.where(in_poly, 'blue', 'red'),
        )
plt.show()

Is there a faster/more efficient way to do this or is this basically The Way?

Thanks for any insights you can provide! :blush: :pray:

Minor update: a Delaunay triangulation of the vertices of the polygon doesn’t work in general, because edges in the polygon are not guaranteed to be in the triangulation. (I don’t know if there’s a way to guarantee it.)

Hi Juan. Welcome to the world of computational geometry!

The triangulation of arbitrary polygons with holes in Matplotlib occurs in the rendering backends. There is an implementation in the Agg backend, but you don’t want to look at that as you will have to understand nearly all of the Agg backend to make progress.

What you are looking for is a constrained Delaunay triangulation. Unfortunately Qhull, the code behind scipy.spatial and indeed matplotlib.tri.triangulation does not support constrained Delaunay.

If you found a constrained Delaunay triangulator then your two-stage approach using a “point in polygon” test would work, but a naive implementation is O(n^2) and thus scales badly, To be performant the “point in poly” code would need to do some sort of spatial partitioning beforehand. I don’t know scikit-image’s code so I don’t know if it is fast and/or scales well, but I note that it doesn’t intrinsically deal with holes.

Possible alternatives: CGAL, triangle, GPC, gluTesselator. These are all written in C/C++. Personally I would use gluTesselator (it has been around for decades and is bulletproof) and vendor it myself, assuming I was adding to an existing repo that already contains C/C++ code. I don’t think napari has any compiled code so this is not a good approach for you. Finding a decent-quality Python wrapper for any of these libraries may be difficult, there are lots around that are essentially unmaintained.

Thanks, I hate it. :joy:

Less flippantly :sweat_smile:, just writing out the question had indeed guided me to that constrained Delaunay Wikipedia page. Thank you to the entire Matplotlib community for being a fantastic collective rubber duck! :duck: That took me to some old papers which unfortunately are not the type of classic that gives you an elegant, easy-to-implement algorithm in pseudocode. :sweat_smile:

It doesn’t, but for now I’m more interested in getting things right than in getting them fast.

It seems to do all right when holes follow the convention of winding in the opposite direction of the outside polygon, which seems to be the case in the data I’ve come across so far…

Thanks! This is already super useful knowledge/advice, as it’s hard to tell which libraries are good out there. Actually I have a WIP using triangle, but unfortunately either the library or the wrapper is segfaulting, so it’s not really the best option for us going forward. :sweat_smile:

Is “tesselate” the same as constrained Delaunay? Knowing/understanding all the terms and variants is half the battle.

This is what I’m finding and what I’m quite surprised about! Do you have any understanding as to why??? I find it quite baffling in 2024! :sweat_smile:

I’m hoping that I can find a clear, liberally-licensed implementation in any language, though, that I can port to either Numba (we’re starting to play with it in napari, and if it becomes essential enough we’ll just add the dependency) or Cython (which I’d then aim to include in skimage, or maybe a standalone thing). But so far it’s all been above my head a little…

Anyway, thank you for your advice and links so far! :pray:

Tesselate is dividing into polygons, triangulate is dividing into triangles. Delaunay is one algorithm for triangulating but there are others.

Actually I think it makes complete sense. It is easy to wrap an existing C/C++ algorithm and give it a Python wrapper to work on a single developer’s computer of choice. The real work is to provide reliable support for this package for ~10 years, dealing with new version of Python, new versions of the underlying library, building it on new hardware/OS platforms, etc. It is only worth undertaking that workload if you a need for it in another package that you care about. In which case why not just put it in the package that you care about? That is what Matplotlib and Scipy have done with Qhull rather than using the existing package that wraps Qhull using Python (and is now unmaintained).

Good luck with Numba. Been there, done that!

If you want to implement your own triangulator then chapter 3 of https://erickimphotography.com/blog/wp-content/uploads/2018/09/Computational-Geometry-Algorithms-and-Applications-3rd-Ed.pdf is a good place to start. It is little dated but is explained well.

LMAO sorry this is off topic but the cover looked familiar — I looked in my bookcase and there sat the second edition — and acting as a bookmark in front of the chapter on Delaunay triangulation was the moving manifest from my move from the US to Australia — dating Sept 2012. :joy: Time to close that loop!!! :rofl:

3 Likes

Do note that triangle is not under a FOSS license:

1 Like

Thanks @QuLogic. I knew that but it would remain an optional dependency in napari. I figured out what was causing the segfaults (can’t have repeated nodes), so my current plan of attack is (1) get the PR merged that will allow some folks to install triangle and get around the bug, then (2) explore the other alternatives (wrap another library, or build our own).

The algorithms involved are in fact annoyingly tricky. I’m finding that a lot of deeper CS data structures, such as self-balancing binary trees, are missing in the SciPy stack. So it’s a longer-term project.