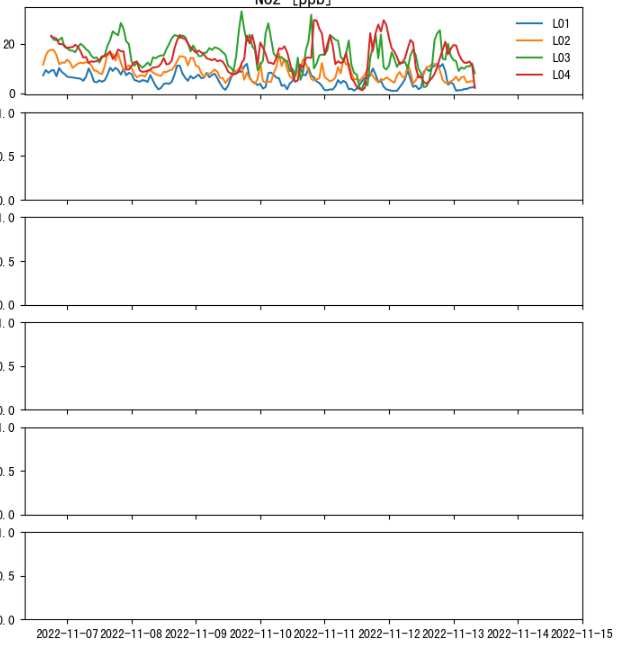
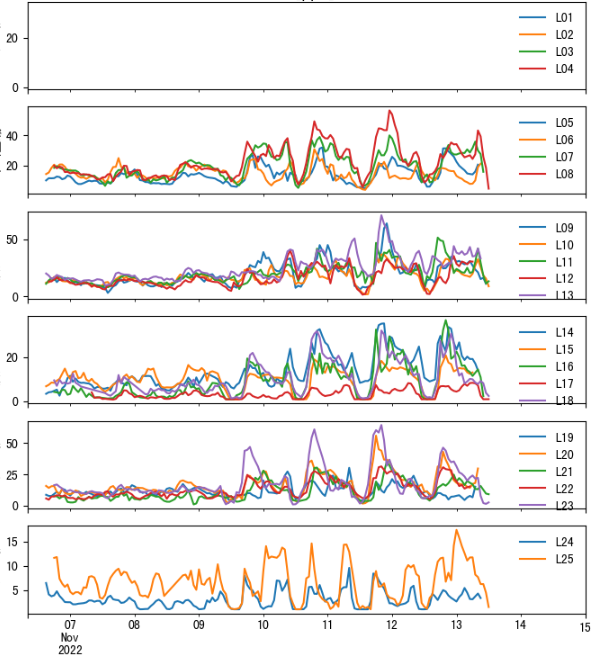
Hi, there. I am trying to make subplots using for loop as below. However, the first plot is not shown.
def ts_plot(var,cluster,ax,i):
    i_var = convert_var_list.index(var)
    var_name = var_name_list[i_var]
    unit = unit_list[i_var]

    df = df_1h
    df_plot = df.loc[df_1h.Cluster ==f'{cluster}']
    df_plot.sort_index(inplace=True)

    time_start = '2022-11-06 12:00:00'
    time_end = '2022-11-14 12:00:00'

    bp = df_plot.groupby('Location')[f'{var}'].plot(kind='line',ax=ax)

for var in convert_var_list[0:1]:
    i = 0
    rows, cols = 6, 1
    fig, axs = plt.subplots(rows, cols,figsize = (8,10),sharex=True)
    for cluster in cluster_list[:]:
        print(i)
        ts_plot(var,cluster,axs[i],i)
        i=i+1
        # Adding a title to the figure
        fig.suptitle(f'{var}', x=0.5, y=0.90, fontsize=14, fontweight ='bold')
If I change the colde “for cluster in cluster_list[:]:” to “for cluster in cluster_list[0:1]:” I will get the first plot but when changing back, it’s gone . Can’f figure out why and how to make all plots shown. Any suggestion is highly appreciated.