Dear All,
I want to stairs plot (similar in matlab) matplotlib
First i want for i data-set then multiple data-set super impose on that.
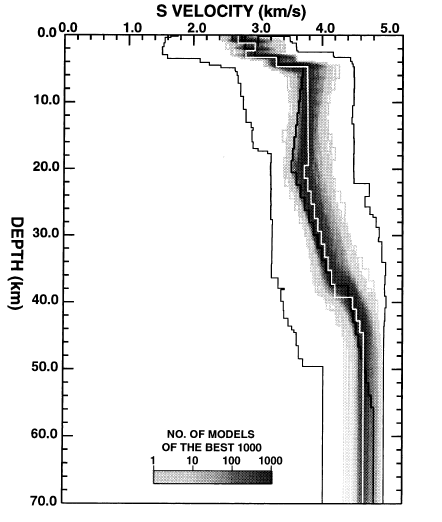
I attach the figure it’s showing velocity-depth stairs plots for superimpose (like hold on in matlab)
large data-set.
can anybody tell me how to plot that.
see the figure
Thank you
···
–
Satish Maurya
Research Scholar
Dear All,
I want to stairs plot (similar in matlab) matplotlib
First i want for i data-set then multiple data-set super impose on that.
I attach the figure it's showing velocity-depth stairs plots for
superimpose (like hold on in matlab)
large data-set.
can anybody tell me how to plot that.
I'm not sure I understand what you're asking. Are you asking how to make
a stairplot, or are you asking how to make *multiple* plots on one set
of axes?
If your question is the former, matplotlib does not currently have a
stairplot implementation, but it wouldn't be hard to use the usual
plot() function to achieve the desired effect:
Before:
x = arange(0, 10, 1)
y = x * (10.0 - x)
plot(x, y)
After:
x = arange(0, 10, 1)
x_m = x - 0.5 # left-hand midpoints
x_p = x + 0.5 # right-hand midpoints
y = x * (10.0 - x)
x_all = dstack((x_m, x, x_p)).flatten()
y_all = dstack((y, y, y)).flatten()
plot(x_all, y_all)
If your question is the latter, you can toggle the hold state just by
calling
hold()
Hope this helps.
···
On Fri, Aug 10, 2012 at 02:09:39PM +0530, satish maurya wrote:
see the figure
Thank you
--
~~~~~~~~~~~~~~~~~~~~~~~~~~~~~~~~~~~~
~~~~~~~~~~~~~~~~~~~~~~~~~~~~~~~~~~~~
*Satish Maurya*
*Research Scholar*
~~~~~~~~~~~~~~~~~~~~~~~~~~~~~~~~~~~~
~~~~~~~~~~~~~~~~~~~~~~~~~~~~~~~~~~~~
--
Damon McDougall
http://damon-is-a-geek.com
B2.39
Mathematics Institute
University of Warwick
Coventry
West Midlands
CV4 7AL
United Kingdom
> Dear All,
>
> I want to stairs plot (similar in matlab) matplotlib
> First i want for i data-set then multiple data-set super impose on that.
> I attach the figure it's showing velocity-depth stairs plots for
> superimpose (like hold on in matlab)
> large data-set.
> can anybody tell me how to plot that.
>
I'm not sure I understand what you're asking. Are you asking how to make
a stairplot, or are you asking how to make *multiple* plots on one set
of axes?
If your question is the former, matplotlib does not currently have a
stairplot implementation, but it wouldn't be hard to use the usual
plot() function to achieve the desired effect:
Actually, I discovered today that this is possible. You can use step()
to achieve what you want:
http://matplotlib.sourceforge.net/examples/pylab_examples/step_demo.html
···
On Fri, Aug 10, 2012 at 12:47:22PM +0100, Damon McDougall wrote:
On Fri, Aug 10, 2012 at 02:09:39PM +0530, satish maurya wrote:
Before:
x = arange(0, 10, 1)
y = x * (10.0 - x)
plot(x, y)
After:
x = arange(0, 10, 1)
x_m = x - 0.5 # left-hand midpoints
x_p = x + 0.5 # right-hand midpoints
y = x * (10.0 - x)
x_all = dstack((x_m, x, x_p)).flatten()
y_all = dstack((y, y, y)).flatten()
plot(x_all, y_all)
If your question is the latter, you can toggle the hold state just by
calling
hold()
Hope this helps.
>
> see the figure
>
> Thank you
>
> --
> ~~~~~~~~~~~~~~~~~~~~~~~~~~~~~~~~~~~~
> ~~~~~~~~~~~~~~~~~~~~~~~~~~~~~~~~~~~~
> *Satish Maurya*
> *Research Scholar*
> ~~~~~~~~~~~~~~~~~~~~~~~~~~~~~~~~~~~~
> ~~~~~~~~~~~~~~~~~~~~~~~~~~~~~~~~~~~~
--
Damon McDougall
http://damon-is-a-geek.com
B2.39
Mathematics Institute
University of Warwick
Coventry
West Midlands
CV4 7AL
United Kingdom
--
Damon McDougall
http://damon-is-a-geek.com
B2.39
Mathematics Institute
University of Warwick
Coventry
West Midlands
CV4 7AL
United Kingdom
[snipped]
Actually, I discovered today that this is possible. You can use step()
to achieve what you want:
http://matplotlib.sourceforge.net/examples/pylab_examples/step_demo.html
Awesome, my question answered before I'd even asked it 
···
On 10/08/2012 21:27, Damon McDougall wrote:
--
Cheers.
Mark Lawrence.