Hi folks,
I have a wxpython GUI that embeds matplotlib plots (using the wxAgg backend). One of these plots has two subplots, and a custom toolbar with buttons to allow you to display either the top subplot, the bottom subplot, or both at once. Previously, to change the subplot visibility I was doing something like this (some code omitted that interacts with toolbar specific stuff):
def showboth(self, evt):
        self.parent.subplot1.set_visible(True)
        self.parent.subplot2.set_visible(True)

        self.parent.subplot1.change_geometry(2,1,1)
        self.parent.subplot2.change_geometry(2,1,2)

        self.parent._plot_shown = 0
        self.parent.canvas.draw()

    def showtop(self, evt):
        self.parent.subplot1.set_visible(True)
        self.parent.subplot2.set_visible(False)

        self.parent.subplot1.change_geometry(1,1,1)

        self.parent.subplot1.set_zorder(2)
        self.parent.subplot2.set_zorder(1)

        self.parent._plot_shown = 1
        self.parent.canvas.draw()

    def showbottom(self, evt):
        self.parent.subplot1.set_visible(False)
        self.parent.subplot2.set_visible(True)

        self.parent.subplot1.set_zorder(1)
        self.parent.subplot2.set_zorder(2)

        self.parent.subplot2.change_geometry(1,1,1)
        self.parent._plot_shown = 2
        self.parent.canvas.draw()
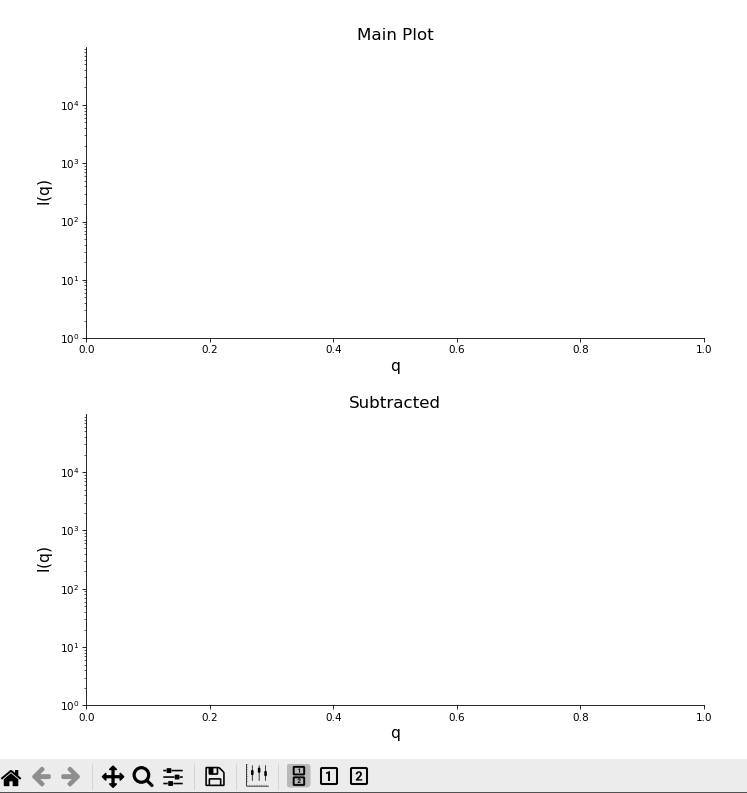
Here’s what it looks like.
Both:
Just top plot:
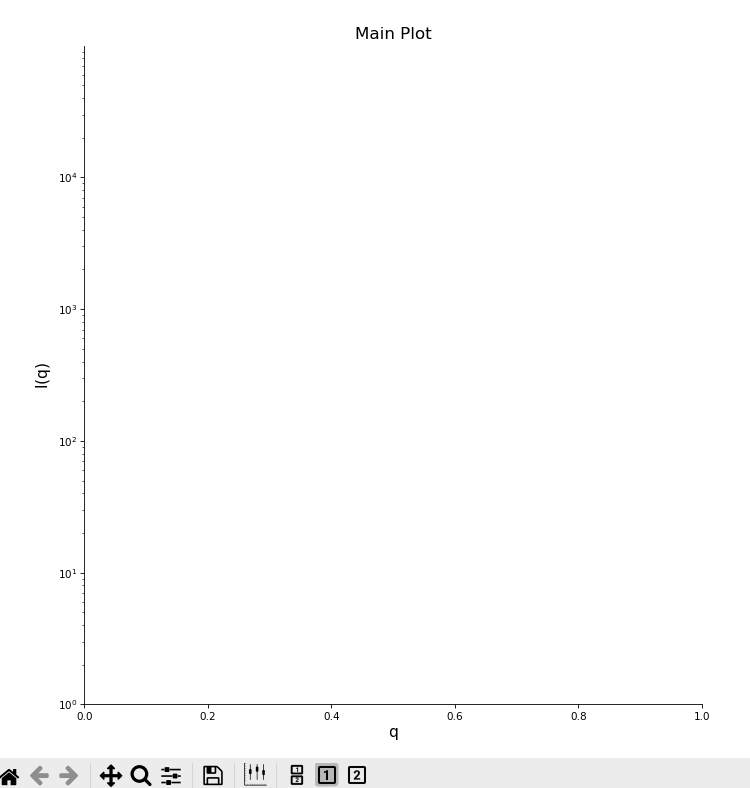
(Just the bottom plot is similar to the just the top plot display, but I can only embed 4 items, so I’m omitting it here)
As of matplotlib version 3.4, the change_geometry function has been depreciated. The api changelog has a somewhat cryptic (to me) note to use the set_subplotspec function instead. I tried to come up with a way to do that, but it wasn’t quite as successful as I hoped. Here’s the code:
def showboth(self, evt):
        self.parent.subplot1.set_visible(True)
        self.parent.subplot2.set_visible(True)

        if ((int(matplotlib.__version__.split('.')[0]) == 3
            and int(matplotlib.__version__.split('.')[0]) >= 4) or
            int(matplotlib.__version__.split('.')[0]) > 3):
            gs = matplotlib.gridspec.GridSpec(2,1)
            self.parent.subplot1.set_subplotspec(gs.new_subplotspec((0,0)))
            self.parent.subplot2.set_subplotspec(gs.new_subplotspec((1,0)))
        else:
            self.parent.subplot1.change_geometry(2,1,1)
            self.parent.subplot2.change_geometry(2,1,2)

        self.parent._plot_shown = 0
        self.parent.canvas.draw()

    def showtop(self, evt):
        self.parent.subplot1.set_visible(True)
        self.parent.subplot2.set_visible(False)


        if ((int(matplotlib.__version__.split('.')[0]) == 3
            and int(matplotlib.__version__.split('.')[1]) >= 4) or
            int(matplotlib.__version__.split('.')[0]) > 3):
            self.parent.subplot1.set_subplotspec(matplotlib.gridspec.GridSpec(1,1).new_subplotspec((0,0)))
        else:
            self.parent.subplot1.change_geometry(1,1,1)

        # self.parent.subplot1.set_zorder(2)
        # self.parent.subplot2.set_zorder(1)

        self.parent._plot_shown = 1
        self.parent.canvas.draw()

    def showbottom(self, evt):

        self.parent.subplot1.set_visible(False)
        self.parent.subplot2.set_visible(True)

        # self.parent.subplot1.set_zorder(1)
        # self.parent.subplot2.set_zorder(2)

        if ((int(matplotlib.__version__.split('.')[0]) == 3
            and int(matplotlib.__version__.split('.')[1]) >= 4) or
            int(matplotlib.__version__.split('.')[0]) > 3):
            self.parent.subplot2.set_subplotspec(matplotlib.gridspec.GridSpec(1,1).new_subplotspec((0,0)))
        else:
            self.parent.subplot2.change_geometry(1,1,1)

        self.parent._plot_shown = 2
        self.parent.canvas.draw()
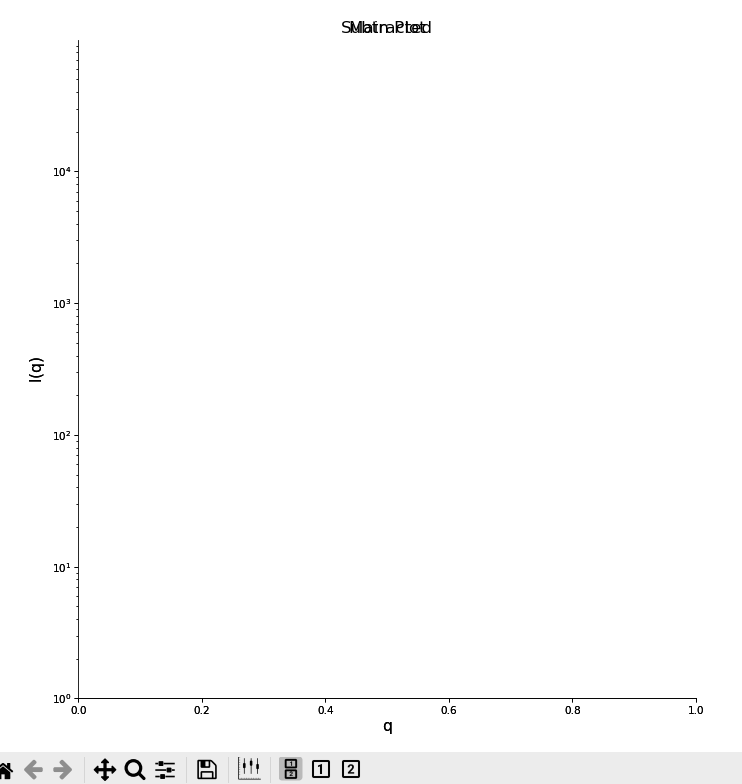
Here’s what it looks like:
Both:
Just top plot:
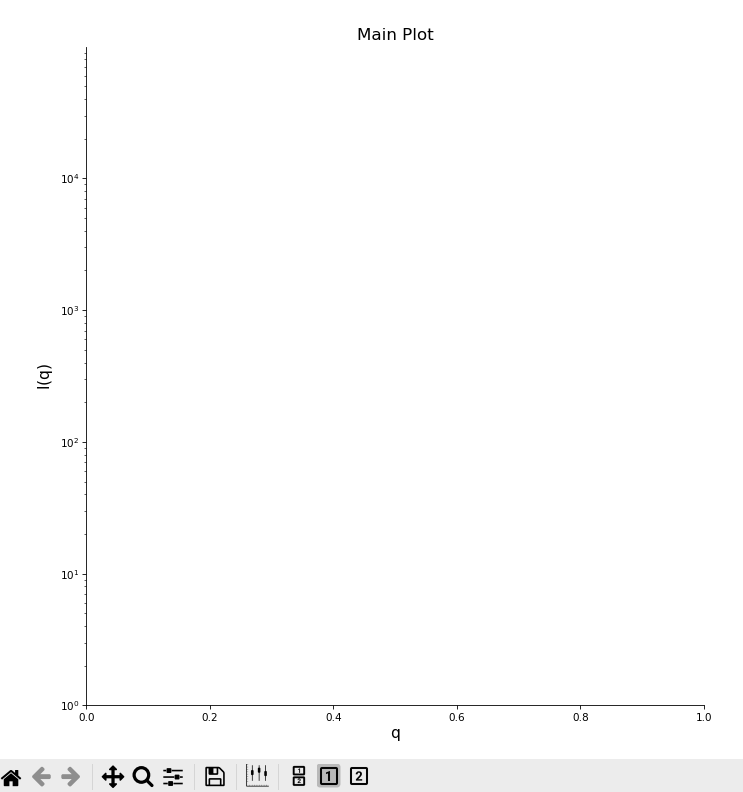
(Just the bottom plot is similar to the just the top plot display, but I can only embed 4 items, so I’m omitting it here)
As you can see, this works fine for showing just the top or bottom subplots, but when you go back to showing both they’re overlaid, rather than showing the two plots (you can see axis ticks for both, and the titles are overlaid, for example. As a note, the plots don’t start out overlaid, the initial display is fine. It’s only once I display either just the top or bottom plot, then go back, that they overlay.
I’m wondering if the issue is that I’m creating a new gridspec? But I can’t see how I would use the original, because the docs don’t seem to show a change_geometry or similar on the gridspec or subplotspec.
Can anyone help me figure out what’s going on? It seems like this should be straightforward, but I can’t see how to do it. I’d appreciate any insight into what’s going on here.
Thanks!
Jesse