Hello,
I'm trying to create a heat map from two lists of corresponding X and Y coordinates.
I've tried both numpy.histogram2d() and pyplot.hexbin().
The histogram I get back doesn't correspond to the points I gave it. It seems as if it's sorting each X and Y list and then eliminating some points, which would definitely not give me the coordinates I want. (Also, I want to be able to switch the origin to the upper-left corner, but I can't figure out how to do this with imshow().)
The hexbin graph does correspond to my original points, but rather than having hexagons of equal size, some are super thin and tiny. (I'd also like to fill in the entire graph with background color (I want the axes to extend beyond the data) - is there a way to do that?)
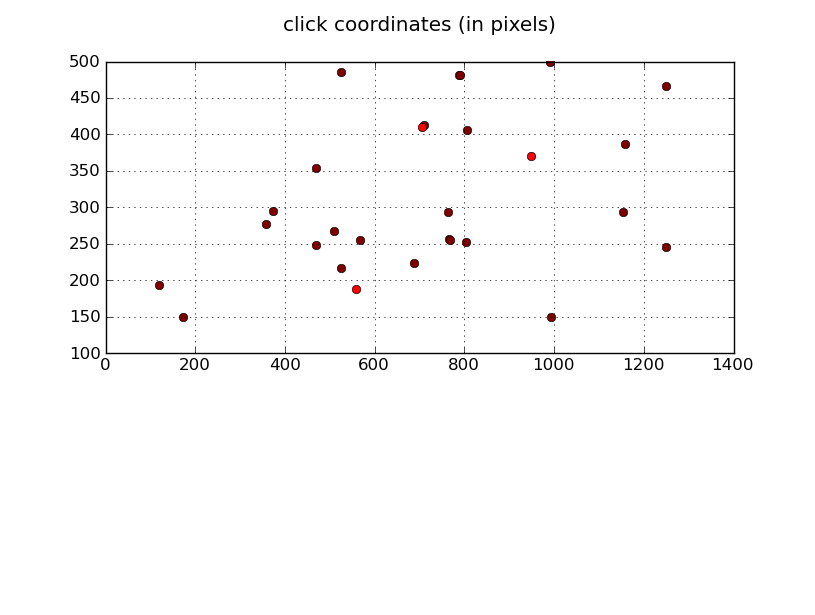
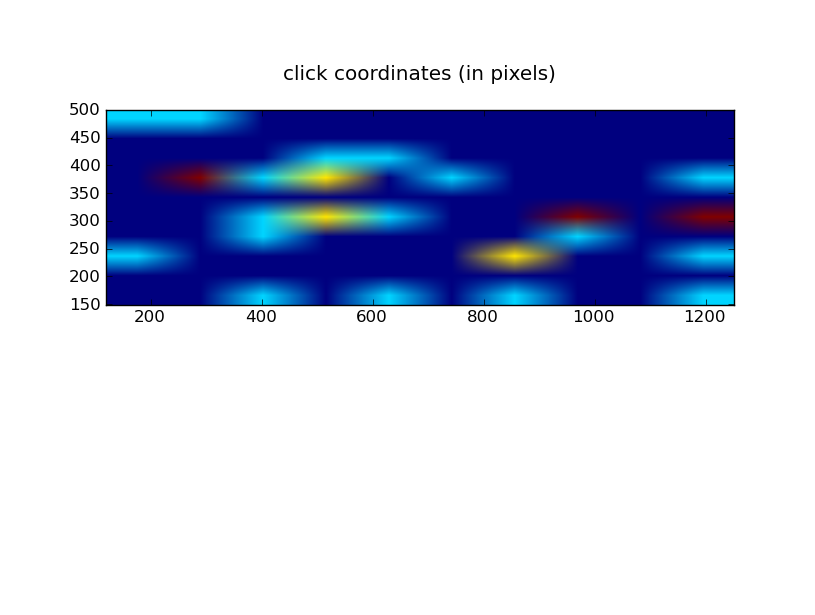
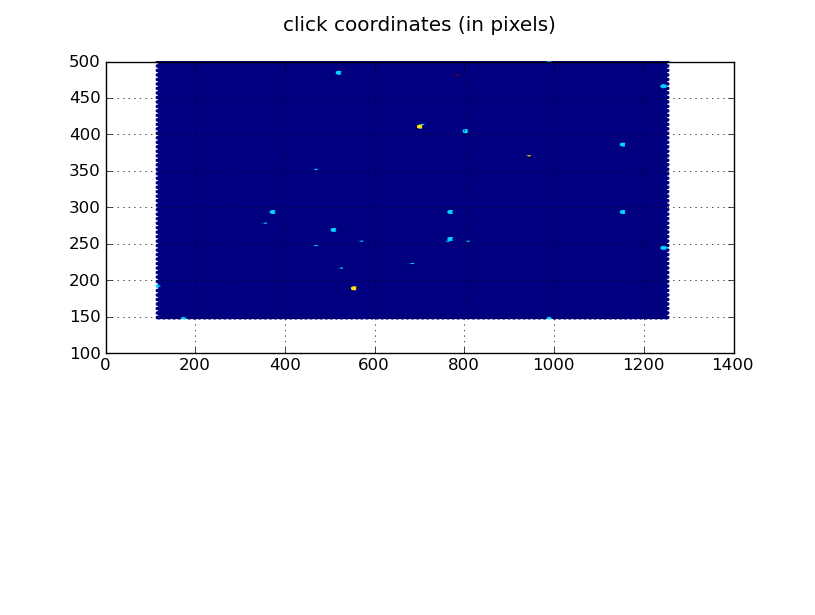
Here's the code I wrote for the histogram and hexbin. Am I doing something wrong? I've attached three graphs - one is my coordinates as a scatter plot, one my histogram result, and the other the hexbin result.
Thanks!
~Rachel
def plotHistogram( coordsTuple ):
plt.clf() # Clears any previous figure
xList = coordsTuple[0]
yList = coordsTuple[1]
heatmap, xedges, yedges = npy.histogram2d(xList, yList)
axesExtent = [0, xedges[-1], 0, yedges[-1]]
plt.imshow(heatmap, extent = axesExtent)
plt.title( "Heat Map of User Clicks" )
name = raw_input("\nImage name and extension: ")
plt.savefig(name)
def plotHexbins( coordsTuple ):
plt.clf() # Clears any previous figure
xList = coordsTuple[0]
yList = coordsTuple[1]
plt.hexbin(xList, yList)
plt.title( "Heat Map of User Clicks" )
name = raw_input("\nImage name and extension: ")
plt.savefig(name)