Linux 2.6.32-25-generic #45-Ubuntu SMP Sat Oct 16 19:48:22 UTC 2010 i686 GNU/Linux
matplotlib 0.99.1.1
The script below is copied from
http://matplotlib.sourceforge.net/examples/pylab_examples/hatch_demo.html
It works. But it can not be saved as an eps file.
I have a lot of histogram plots using “hatch” needed to be saved as eps, is it possible to fix this bug?
Thanks.
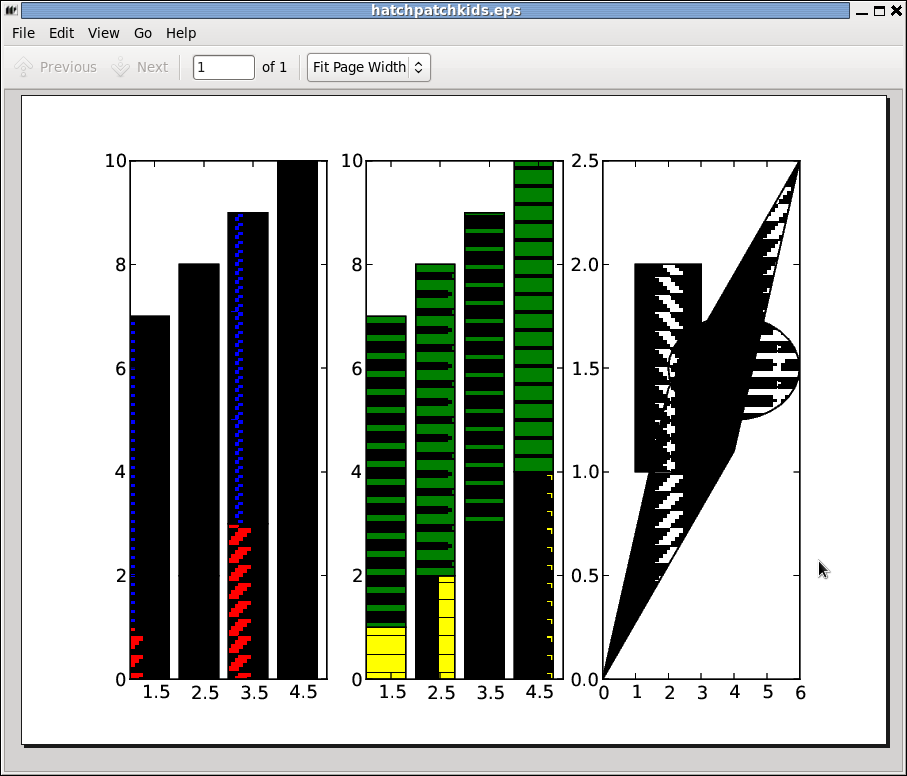
"""

Hatching (pattern filled polygons) is supported currently in the PS,
PDF, SVG and Agg backends only.
"""
import matplotlib.pyplot as plt

from matplotlib.patches import Ellipse, Polygon

fig = plt.figure()

ax1 = fig.add_subplot(131)
ax1.bar(range(1,5), range(1,5), color='red', edgecolor='black', hatch="/")

ax1.bar(range(1,5), [6] * 4, bottom=range(1,5), color='blue', edgecolor='black', hatch='//')

ax1.set_xticks([1.5,2.5,3.5,4.5])

ax2 = fig.add_subplot(132)
bars = ax2.bar(range(1,5), range(1,5), color='yellow', ecolor='black') + \

    ax2.bar(range(1, 5), [6] * 4, bottom=range(1,5), color='green', ecolor='black')

ax2.set_xticks([1.5,2.5,3.5,4.5])

patterns = ('-', '+', 'x', '\\', '*', 'o', 'O', '.')

for bar, pattern in zip(bars, patterns):

     bar.set_hatch(pattern)

ax3 = fig.add_subplot(133)

ax3.fill([1,3,3,1],[1,1,2,2], fill=False, hatch='\\')

ax3.add_patch(Ellipse((4,1.5), 4, 0.5, fill=False, hatch='*'))

ax3.add_patch(Polygon([[0,0],[4,1.1],[6,2.5],[2,1.4]], closed=True,

                      fill=False, hatch='/'))

ax3.set_xlim((0,6))
ax3.set_ylim((0,2.5))

plt.show()