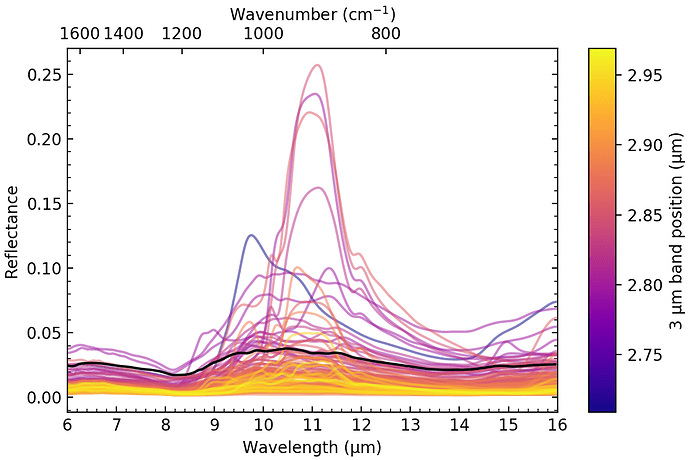
Hey everyone!
Plotting some spectroscopy data and wanted to have two x-axes that are nonlinearly related to each other (wavelength on the bottom and wavenumber on the top). After trying a few different methods, like twiny(), I found that ax2 = ax.secondary_xaxis() proved to be the most simple and robust solution.
The issue that I’m having though is in getting minor ticks to show up on the newly created secondary x-axis (the top one). I think I’ve tried all the usual solutions like ax.tick_params() and ax2.minorticks_on() but no luck. Curiously though, ax.tick_params() is useful in getting the ticks inverted, which is great.
Does anyone in the community have suggestions on how to get minor ticks to show here?
Relevant snippet of code:
ax2 = ax.secondary_xaxis('top', functions=(forward,inverse))
ax2.set_xlabel('Wavenumber (cm$^{-1}$)')
ax2.tick_params(which = 'both', direction='in', top = True)