Hello,
Is there a way to plot half-filled markers in matplotlib ?
For example, I would like to use a circle marker, lower half filled in black while the upper half is white.
Thanks,
Eli
Hello,
Is there a way to plot half-filled markers in matplotlib ?
For example, I would like to use a circle marker, lower half filled in black while the upper half is white.
Thanks,
Eli
Hello,
A few weeks earlier I was asking whether it is possible to plot half-filled markers in matplotlib.
As I got no answers I tried to do it myself.
There are several ways to do it. For example, I considered following the example in
http://matplotlib.sourceforge.net/examples/api/scatter_piecharts.html
but with the approach described there I could not reproduce the custom marker in the legend.
The approach that did work was to modify the lines.py file in the matplotlib folder.
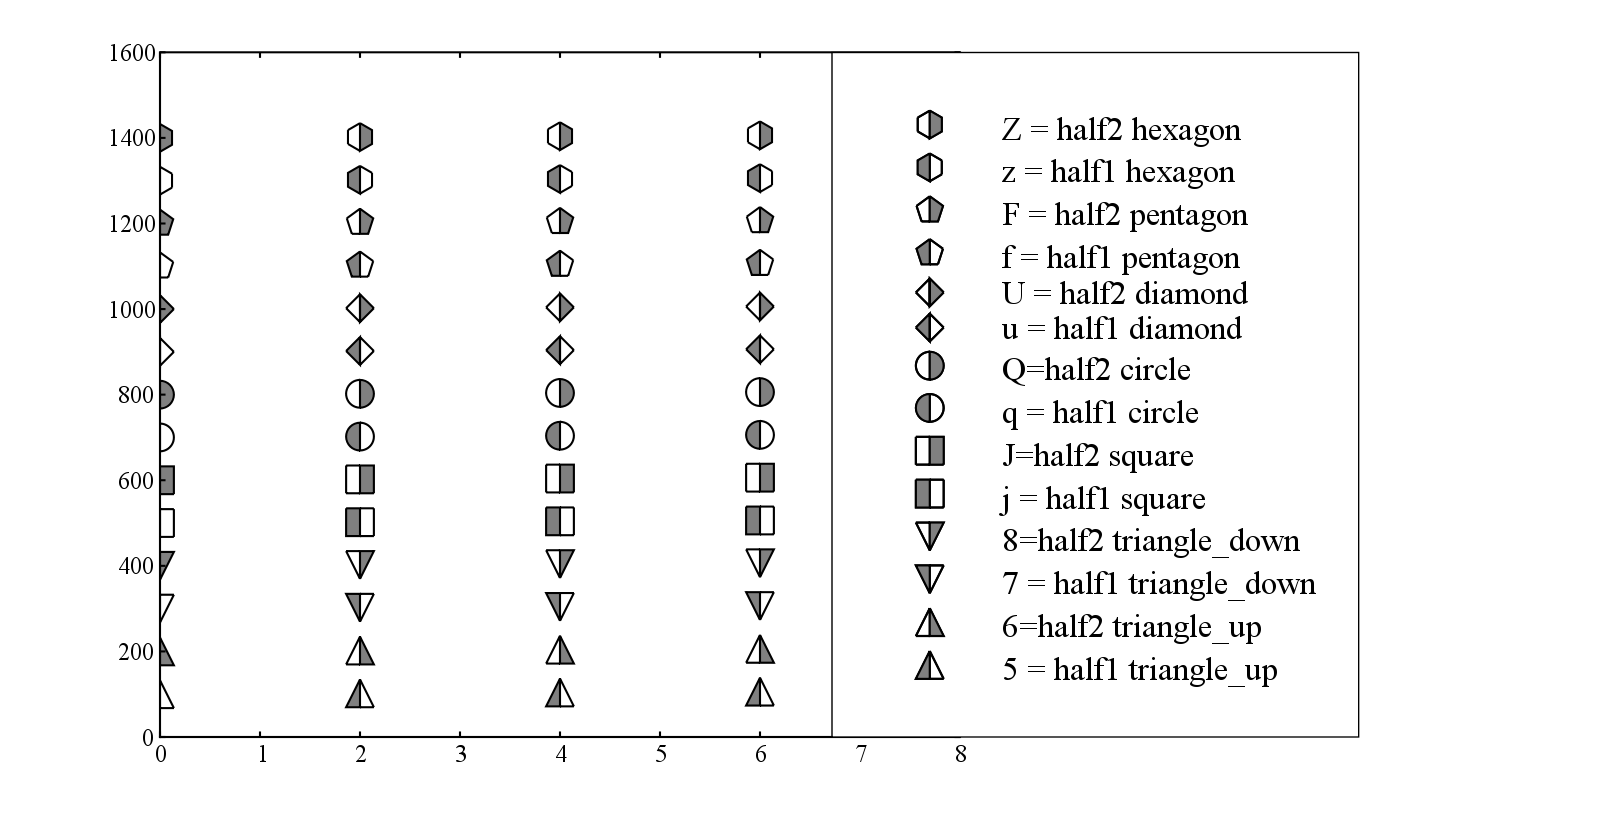
My version of the file is attached with several new markers added.
The implementation is not very elegant but half-filled markers are quite useful when plotting lots of data.
Does anyone have a better idea for the implementation of half-filled markers in matplotlib ?
Eli
lines.py (50.4 KB)
try_half-filled_markers.py (1.73 KB)
On Fri, Jun 12, 2009 at 8:55 PM, Eli Brosh <ebrosh1@…287…> wrote:
Hello,
Is there a way to plot half-filled markers in matplotlib ?For example, I would like to use a circle marker, lower half filled in black while the upper half is white.
Thanks,
Eli
This looks interesting, and the functionality is certainly nice, but
it looks like a brute force hammer approach when a scapel might be
preferable, For example, what if we introduce a new kwarg fillstyle
with options 'full|top|bottom|left|right' so *any* marker could be
half filled. This would result in both less code and more
functionality. If you are interested in tackling this, I'd be happy
to consider a patch. Please see
http://matplotlib.sourceforge.net/faq/howto_faq.html#submit-a-patch
JDH
On Sat, Jul 11, 2009 at 3:43 AM, Eli Brosh<[email protected]...> wrote:
Hello,
A few weeks earlier I was asking whether it is possible to plot half-filled
markers in matplotlib.
As I got no answers I tried to do it myself.
There are several ways to do it. For example, I considered following the
example in
http://matplotlib.sourceforge.net/examples/api/scatter_piecharts.html
but with the approach described there I could not reproduce the custom
marker in the legend.The approach that did work was to modify the lines.py file in the matplotlib
folder.
My version of the file is attached with several new markers added.The implementation is not very elegant but half-filled markers are quite
useful when plotting lots of data.Does anyone have a better idea for the implementation of half-filled markers
in matplotlib ?
Thanks John,
A kwarg fillstyle with options ‘full|top|bottom|left|right’ for any marker is certainly better than what i have done.
I just did not have an idea how to program this kwarg.
Further, I can’t see an easy way of generalizing the half-filling of markers.
is there a better way than just programming each half-filled marker separately ?
Perhaps if you can give me some hints, I can try to do the rest of the work.
Eli
On Sat, Jul 11, 2009 at 4:28 PM, John Hunter <jdh2358@…287…> wrote:
On Sat, Jul 11, 2009 at 3:43 AM, Eli Brosh<ebrosh1@…287…> wrote:
Hello,
A few weeks earlier I was asking whether it is possible to plot half-filled
markers in matplotlib.
As I got no answers I tried to do it myself.
There are several ways to do it. For example, I considered following the
example in
http://matplotlib.sourceforge.net/examples/api/scatter_piecharts.html
but with the approach described there I could not reproduce the custom
marker in the legend.
The approach that did work was to modify the lines.py file in the matplotlib
folder.
My version of the file is attached with several new markers added.
The implementation is not very elegant but half-filled markers are quite
useful when plotting lots of data.
Does anyone have a better idea for the implementation of half-filled markers
in matplotlib ?
This looks interesting, and the functionality is certainly nice, but
it looks like a brute force hammer approach when a scapel might be
preferable, For example, what if we introduce a new kwarg fillstyle
with options ‘full|top|bottom|left|right’ so any marker could be
half filled. This would result in both less code and more
functionality. If you are interested in tackling this, I’d be happy
to consider a patch. Please see
http://matplotlib.sourceforge.net/faq/howto_faq.html#submit-a-patch
JDH
Sure, first take a look at the coding guide, in particular these two
sections which introduce kwarg processing and documentation
conventions.
http://matplotlib.sourceforge.net/devel/coding_guide.html#keyword-argument-processing
http://matplotlib.sourceforge.net/devel/coding_guide.html#documentation-and-docstrings
Basically, any new "property", where I use quotes because mpl
properties are not the same as python properties, needs a setter and
getter. The setter must also have an ACCEPTS flag, which gives the
acceptable arguments. mpl uses these in the setp and getp
introspection facilities, as well as in the auto-table building of
kwargs in the docs. The artist.ArtistInspector is used to insepct the
functions and docs to extract the properties:
http://matplotlib.sourceforge.net/api/artist_api.html#matplotlib.artist.ArtistInspector
I've committed a patch to svn that implements the fillstyle property
for Line2D, and implemented it for draw_square. The other filled
markers raise a NotImplementedError if the fillstyle is not 'full',
and that is where you come in. The basic implementation is to draw
two half markers, one filled and one unfilled, and use the rotation
property of the transformation to support the various
left>right>bottom>top. Here is the reference implementation for
draw_square::
def _draw_square(self, renderer, gc, path, path_trans):

    gc.set_snap(renderer.points_to_pixels(self._markersize) >= 2.0)

    side = renderer.points_to_pixels(self._markersize)

    transform = Affine2D().translate(-0.5, -0.5).scale(side)

    rgbFace = self._get_rgb_face()

    fs = self.get_fillstyle()

    if fs=='full':

        renderer.draw_markers(gc, Path.unit_rectangle(), transform,

                              path, path_trans, rgbFace)

    else:

        # build a bottom filled square out of two rectangles, one

        # filled.  Use the rotation to support left, right, bottom

        # or top

        if fs=='bottom': rotate = 0.

        elif fs=='top': rotate = 180.

        elif fs=='left': rotate = 270.

        else: rotate = 90.


        bottom = Path([[0.0, 0.0], [1.0, 0.0], [1.0, 0.5], [0.0,
0.5], [0.0, 0.0]])
top = Path([[0.0, 0.5], [1.0, 0.5], [1.0, 1.0], [0.0,
1.0], [0.0, 0.05]])
        transform = transform.rotate_deg(rotate)

        renderer.draw_markers(gc, bottom, transform,

                              path, path_trans, rgbFace)

        renderer.draw_markers(gc, top, transform,

                              path, path_trans, None)
See examples/pylab_examples/fillstyle_demo.py in svn, and the attached
patch (although this is already committed, it might be instructional
so you can see the steps needed to add a new property). When you
finish the others, send along an svn diff and some more examples in
the fillstyle_demo and I'll commit it.
Thanks!
JDH
fillstyle.diff (9 KB)
On Sat, Jul 11, 2009 at 9:55 AM, Eli Brosh<[email protected]...> wrote:
Thanks John,
A kwarg fillstyle with options 'full|top|bottom|left|right' for any marker
is certainly better than what i have done.
I just did not have an idea how to program this kwarg.
Further, I can't see an easy way of generalizing the half-filling of
markers.
is there a better way than just programming each half-filled marker
separately ?
Perhaps if you can give me some hints, I can try to do the rest of the work.
Thanks John,
Sorry, this is too heavy for my programming skills.
I hope to be able to contribute some time later.
Eli
On Sat, Jul 11, 2009 at 7:55 PM, John Hunter <jdh2358@…1972…> wrote:
On Sat, Jul 11, 2009 at 9:55 AM, Eli Brosh<ebrosh1@…287…> wrote:
Thanks John,
A kwarg fillstyle with options ‘full|top|bottom|left|right’ for any marker
is certainly better than what i have done.
I just did not have an idea how to program this kwarg.
Further, I can’t see an easy way of generalizing the half-filling of
markers.
is there a better way than just programming each half-filled marker
separately ?
Perhaps if you can give me some hints, I can try to do the rest of the work.
Sure, first take a look at the coding guide, in particular these two
sections which introduce kwarg processing and documentation
conventions.
http://matplotlib.sourceforge.net/devel/coding_guide.html#keyword-argument-processing
http://matplotlib.sourceforge.net/devel/coding_guide.html#documentation-and-docstrings
Basically, any new “property”, where I use quotes because mpl
properties are not the same as python properties, needs a setter and
getter. The setter must also have an ACCEPTS flag, which gives the
acceptable arguments. mpl uses these in the setp and getp
introspection facilities, as well as in the auto-table building of
kwargs in the docs. The artist.ArtistInspector is used to insepct the
functions and docs to extract the properties:
http://matplotlib.sourceforge.net/api/artist_api.html#matplotlib.artist.ArtistInspector
I’ve committed a patch to svn that implements the fillstyle property
for Line2D, and implemented it for draw_square. The other filled
markers raise a NotImplementedError if the fillstyle is not ‘full’,
and that is where you come in. The basic implementation is to draw
two half markers, one filled and one unfilled, and use the rotation
property of the transformation to support the various
left>right>bottom>top. Here is the reference implementation for
draw_square::
def _draw_square(self, renderer, gc, path, path_trans): gc.set_snap(renderer.points_to_pixels(self._markersize) >= 2.0) side = renderer.points_to_pixels(self._markersize) transform = Affine2D().translate(-0.5, -0.5).scale(side) rgbFace = self._get_rgb_face() fs = self.get_fillstyle() if fs=='full': renderer.draw_markers(gc, Path.unit_rectangle(), transform, path, path_trans, rgbFace) else: # build a bottom filled square out of two rectangles, one # filled. Use the rotation to support left, right, bottom # or top if fs=='bottom': rotate = 0. elif fs=='top': rotate = 180. elif fs=='left': rotate = 270. else: rotate = 90. bottom = Path([[0.0, 0.0], [1.0, 0.0], [1.0, 0.5], [0.0,0.5], [0.0, 0.0]])
top = Path([[0.0, 0.5], [1.0, 0.5], [1.0, 1.0], [0.0,1.0], [0.0, 0.05]])
transform = transform.rotate_deg(rotate) renderer.draw_markers(gc, bottom, transform, path, path_trans, rgbFace) renderer.draw_markers(gc, top, transform, path, path_trans, None)See examples/pylab_examples/fillstyle_demo.py in svn, and the attached
patch (although this is already committed, it might be instructional
so you can see the steps needed to add a new property). When you
finish the others, send along an svn diff and some more examples in
the fillstyle_demo and I’ll commit it.
Thanks!
JDH