Hello,
First of all, I’m so sorry if I make a silly question or if it’s explained anywhere, buy I can’t find help.
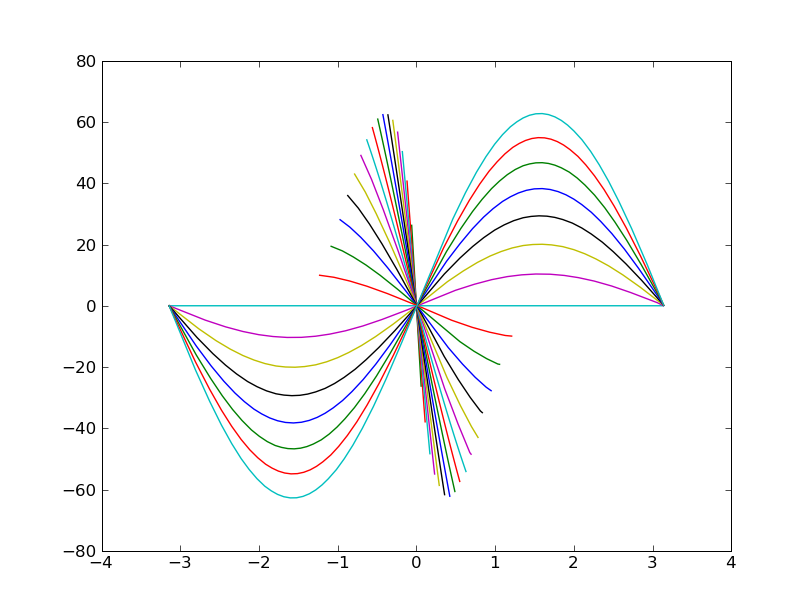
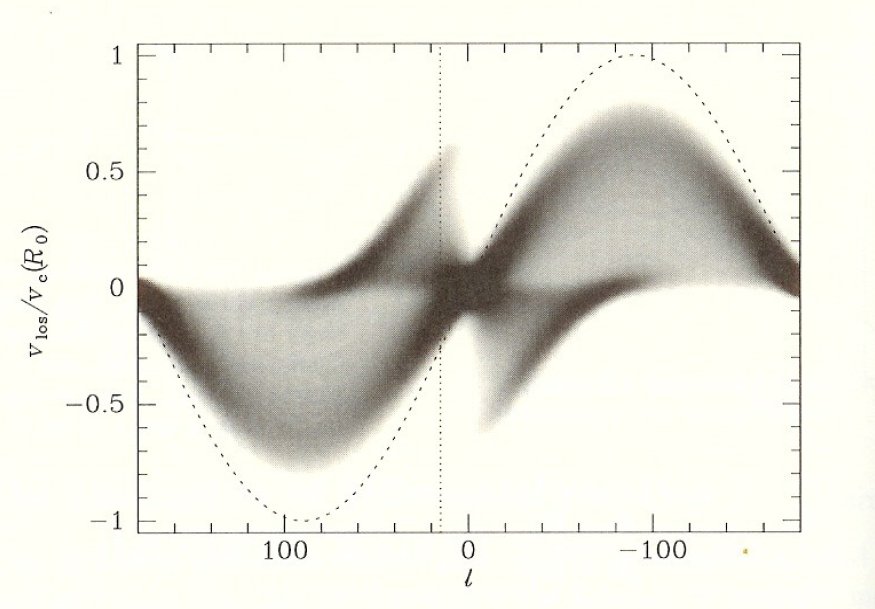
I have to do a grayscale figure for the function show in fig1, using a density function, and obtain the picture from fig2.
I have tried a lot of things, but at the end I don’t know how to do it.
The fig1 representes l vs vl(l) for different R values, but the density depends on l and R, no on vl.
At the end, the only way I foud is: Make a grid, for an R value,go through all the [x,y] points, asking if the function vl is defined there and, if so, calculating the density, and then adding the values for all the R.
It seems a really hard way of doing it, that’s way I would like to know if anyone have other idea.
I would be really thankful if anyone can help me, because I’m frustated with this problem
Thank you very much,
Illa