Hi All,
Is there any way in MPL to do gradient filled bars like you can in Excel? (click data series -> format data series -> patterns -> fill effects -> gradient -> diagonal up)
cheers,
Chris
···
--
Simplistix - Content Management, Zope & Python Consulting
- http://www.simplistix.co.uk
Chris Withers wrote:
Hi All,
Is there any way in MPL to do gradient filled bars like you can in Excel? (click data series -> format data series -> patterns -> fill effects -> gradient -> diagonal up)
cheers,
Chris
Short of laboriously putting an image in each bar, no.
Eric
Eric Firing wrote:
Short of laboriously putting an image in each bar, no.
That's a shame 
So, no gradient filled patches in MPL?
Chris
···
--
Simplistix - Content Management, Zope & Python Consulting
- http://www.simplistix.co.uk
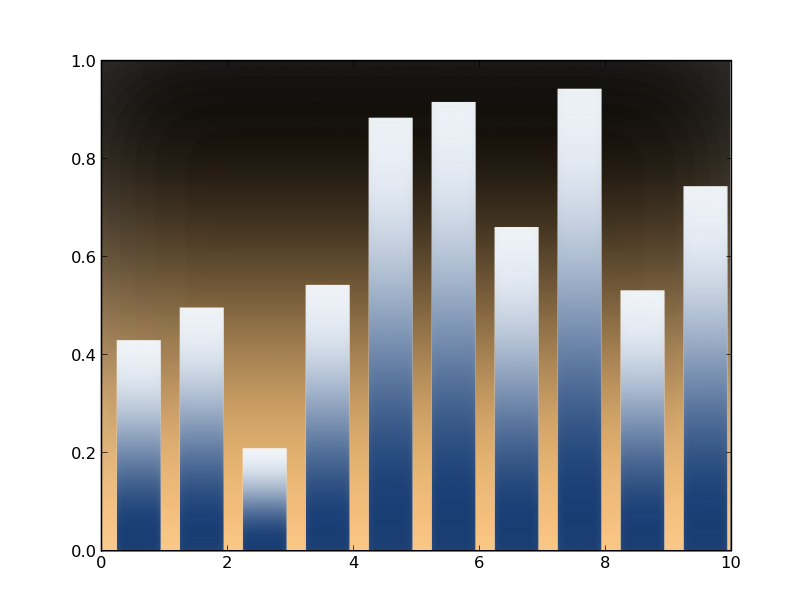
It's on the wish-list. You can hack a solution using matplotlib
images: http://matplotlib.sf.net/examples/gradient_bar.py .. The
postscript backend has support for hatches see the set_hatch method
for http://matplotlib.sourceforge.net/matplotlib.patches.html#Patch
but this hasn't been ported to any other backend AFAIK.
···
On Wed, Mar 19, 2008 at 4:40 AM, Chris Withers <[email protected]...> wrote:
That's a shame
So, no gradient filled patches in MPL?