Hi,
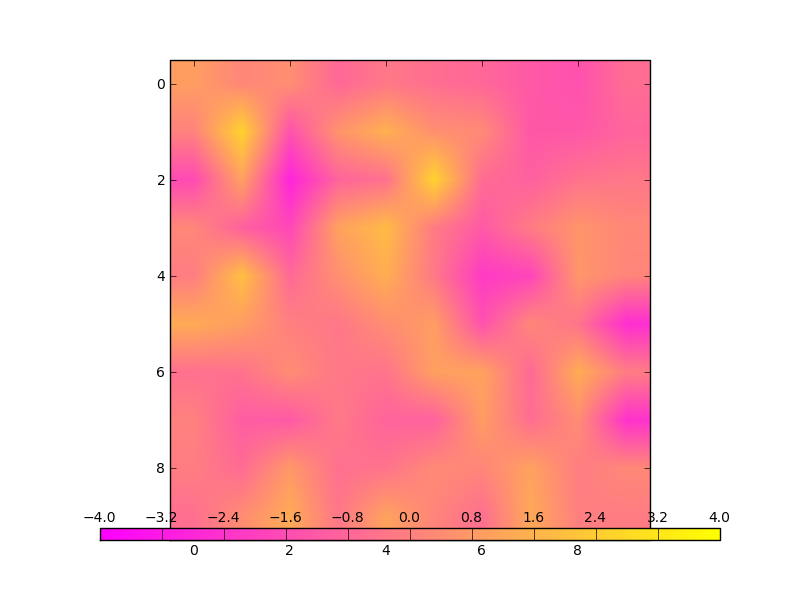
I’m trying to make a colorbar that occupies the bottom extent of an axes:
import numpy as np
import matplotlib.pyplot as plt
from matplotlib.colorbar import ColorbarBase
from matplotlib.colors import Normalize
colorbar_height = 0.02
data = np.random.randn(10,10)
fig = plt.figure()
ax = fig.add_subplot(1, 1, 1)
norm = Normalize(-4, 4)
cmap = plt.get_cmap(‘spring’)
ax.imshow(data, norm=norm, cmap=cmap)
cpos = list(ax.get_position().bounds)
cpos[-1] = colorbar_height
cax = fig.add_axes(cpos)
cbar = ColorbarBase(cax, norm=norm, cmap=cmap, orientation=‘horizontal’)
cax.xaxis.set_ticks_position(’
top’)
cax.xaxis.set_ticks_position(‘both’)
plt.show()
The
problem is, because this is an image, at draw time, the axes aspect
ratio (and hence its bounds) get updated, but the colorbar does not get
this update. This produces a colorbar much longer than the actual
extent of the axes. (See attached.) Is there a way to give the
colorbar axes a bbox that is modified but still linked to the axes
bbox? Or is there a way to force the axes to update its bbox before
being drawn? I showed off a version of this code that worked great in
the interactive shell earlier, but I’m having an epic fail at getting
this to work within a script. I’ve taken this same approach before,
but I think I’ve just been lucky in how the axes aspect ratio was
handled.
Ryan
···
–
Ryan May
Graduate Research Assistant
School of Meteorology
University of Oklahoma
Sent from Norman, Oklahoma, United States
Hi Ryan,
The Axes in the svn version of the mpl has a "axes_locator" property ,
which is meant to be used to update the location of the axes at the
drawing time.
Try to insert the following code before the "show" and see if it works for you.
from matplotlib.transforms import Bbox
def update_pos(cbar_axes, renderer):
cpos = list(ax.get_position().bounds)
cpos[-1] = colorbar_height
return Bbox.from_bounds(*cpos)
cax.set_axes_locator(update_pos)
Also, you may be interested in the "axes_grid" toolkit that I recently
checked in to the trunk, although it would be a bit more tricky to
place the colorbar at the bottom of the axes. Anyhow, you may take a
look at "examples/axes_grid/demo_axes_divider.py".
Regards,
-JJ
···
On Thu, Apr 23, 2009 at 6:12 PM, Ryan May <[email protected]...> wrote:
Hi,
I'm trying to make a colorbar that occupies the bottom extent of an axes:
import numpy as np
import matplotlib.pyplot as plt
from matplotlib.colorbar import ColorbarBase
from matplotlib.colors import Normalize
colorbar_height = 0.02
data = np.random.randn(10,10)
fig = plt.figure()
ax = fig.add_subplot(1, 1, 1)
norm = Normalize(-4, 4)
cmap = plt.get_cmap('spring')
ax.imshow(data, norm=norm, cmap=cmap)
cpos = list(ax.get_position().bounds)
cpos[-1] = colorbar_height
cax = fig.add_axes(cpos)
cbar = ColorbarBase(cax, norm=norm, cmap=cmap, orientation='horizontal')
cax.xaxis.set_ticks_position('
top')
cax.xaxis.set_ticks_position('both')
plt.show()
The problem is, because this is an image, at draw time, the axes aspect
ratio (and hence its bounds) get updated, but the colorbar does not get this
update. This produces a colorbar much longer than the actual extent of the
axes. (See attached.) Is there a way to give the colorbar axes a bbox that
is modified but still linked to the axes bbox? Or is there a way to force
the axes to update its bbox before being drawn? I showed off a version of
this code that worked great in the interactive shell earlier, but I'm having
an epic fail at getting this to work within a script. I've taken this same
approach before, but I think I've just been lucky in how the axes aspect
ratio was handled.
Ryan
--
Ryan May
Graduate Research Assistant
School of Meteorology
University of Oklahoma
Sent from Norman, Oklahoma, United States
------------------------------------------------------------------------------
Crystal Reports - New Free Runtime and 30 Day Trial
Check out the new simplified licensign option that enables unlimited
royalty-free distribution of the report engine for externally facing
server and web deployment.
http://p.sf.net/sfu/businessobjects
_______________________________________________
Matplotlib-users mailing list
[email protected]
matplotlib-users List Signup and Options