following on with the same data, adding x_compat=True to the call, more details of attempts and results, none of which come close to intended result.
To repeat, my objective is:
-
x-axis: Print the years in the format 2020 and the months corresponding to the first and third quarters abbreviated to Jan and Jul
-
y-axis: Print the labels 19,000, 20,000, 21,000, 22,000
1. Experiment with dates : attempts to use MonthLocator(1,7)
fails because 7th month is missing
from matplotlib.dates import YearLocator, MonthLocator, DateFormatter
f, ax = plt.subplots()
df.plot(ax=ax, x='Date', x_compat=True)
ax.xaxis.set_major_locator(YearLocator(1))
ax.xaxis.set_major_formatter(DateFormatter('\n%Y'))
ax.xaxis.set_minor_locator(MonthLocator(1,7))      # <- July missing
ax.xaxis.set_minor_formatter(DateFormatter('%b'))
plt.savefig("dates-1.png")
plt.show()
AS A NEW USER I AM ALLOWED ONLY ONE EMBEDDED IMAGE. UNFORTUNATELY I MUST REMOVE THE IMAGES BELOW. THEY MAY BE REPRODUCED WITH THE CODE.
2. Experiment with dates: attempts to use ‘bymonth’ inside MonthLocator
bymonth=6 should show every 6 months, fails because only June appears
from matplotlib.dates import YearLocator, MonthLocator, DateFormatter
f, ax = plt.subplots()
df.plot(ax=ax, x='Date', x_compat=True)
ax.xaxis.set_major_locator(YearLocator(1))
ax.xaxis.set_major_formatter(DateFormatter('\n%Y'))
ax.xaxis.set_minor_locator(MonthLocator(bymonth=6))
ax.xaxis.set_minor_formatter(DateFormatter('%b'))
plt.savefig("dates-2.png")
plt.show()
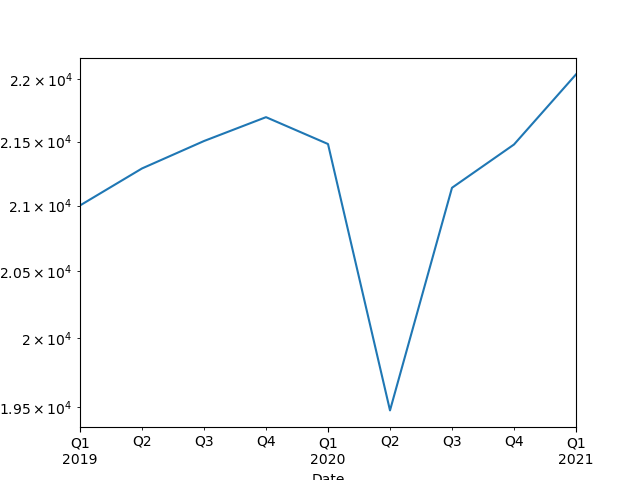
3: Experiment with dates: attempt to use ‘interval’ inside MonthLocator
not expected to work, but almost works
fails because prints Mar and Sep instead of Jan and July
from matplotlib.dates import YearLocator, MonthLocator, DateFormatter
f, ax = plt.subplots()
df.plot(ax=ax, x='Date', x_compat=True)
ax.xaxis.set_major_locator(YearLocator(1))
ax.xaxis.set_major_formatter(DateFormatter('\n%Y'))
ax.xaxis.set_minor_locator(MonthLocator(interval=6))
ax.xaxis.set_minor_formatter(DateFormatter('%b'))
plt.savefig("dates-3.png")
plt.show()
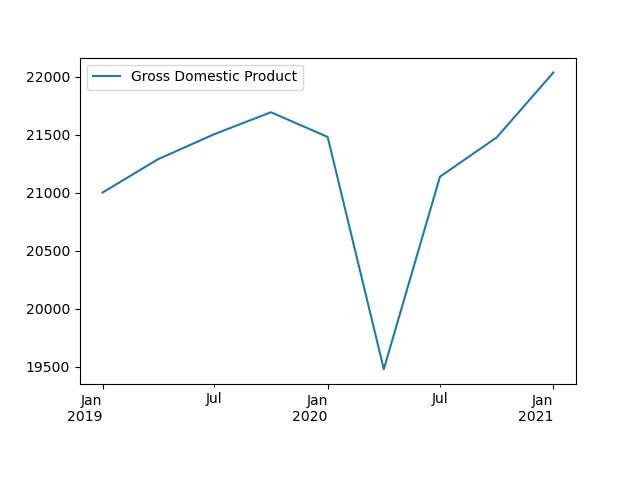
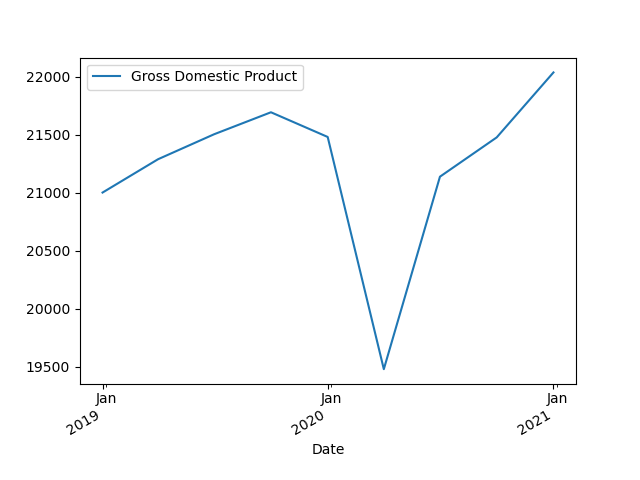
4: Experiment with dates: combining interval and bymonth
with interval=1, bymonth=2 gives February, bymonth=3 gives March,
maybe a combo of interval and bymonth? unfortunately, couldn’t find the right way…
from matplotlib.dates import YearLocator, MonthLocator, DateFormatter
f, ax = plt.subplots()
df.plot(ax=ax, x='Date', x_compat=True)
ax.xaxis.set_major_locator(YearLocator(1))
ax.xaxis.set_major_formatter(DateFormatter('\n%Y'))
ax.xaxis.set_minor_locator(MonthLocator(interval=6, bymonth=7))
ax.xaxis.set_minor_formatter(DateFormatter('%b'))
ax.xaxis.set_tick_params(rotation=0)  # default is to tilt the date
ax.xaxis.set_tick_params(length=0, width=0, which='minor')  # hide extra tick
ax.xaxis.set_label_text('')
plt.savefig("dates-4.png")
plt.show()
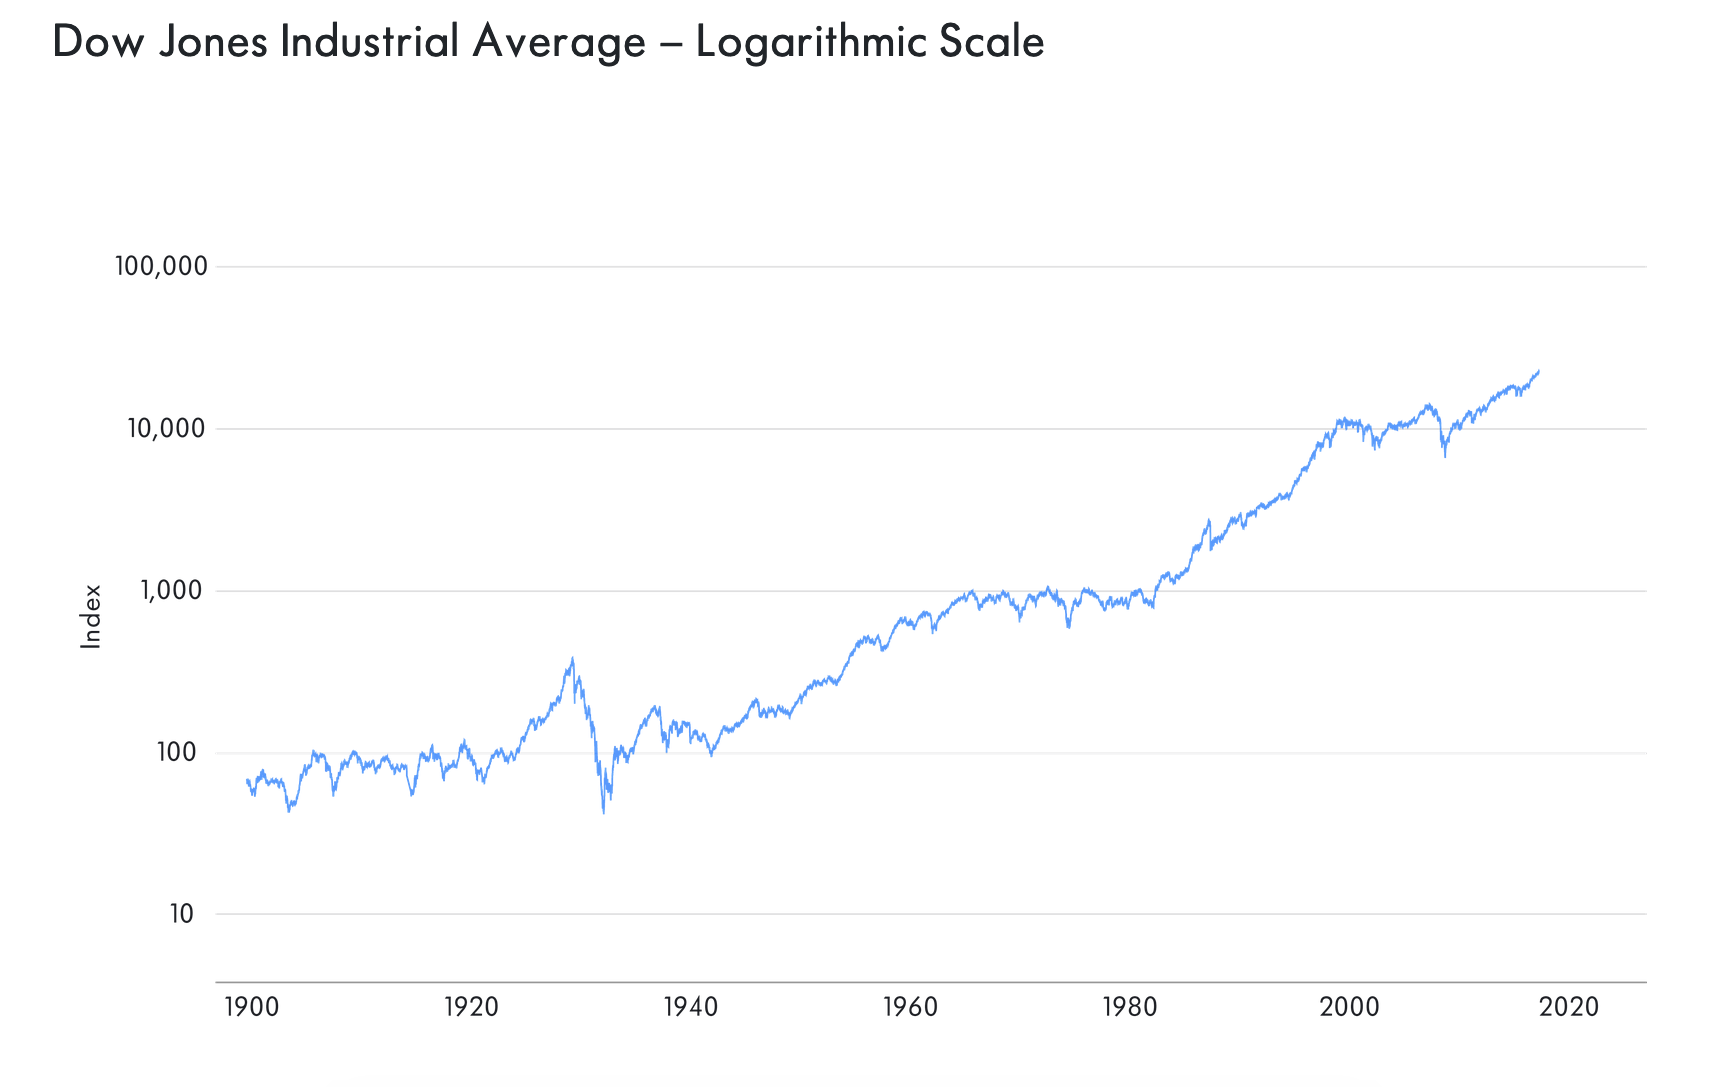
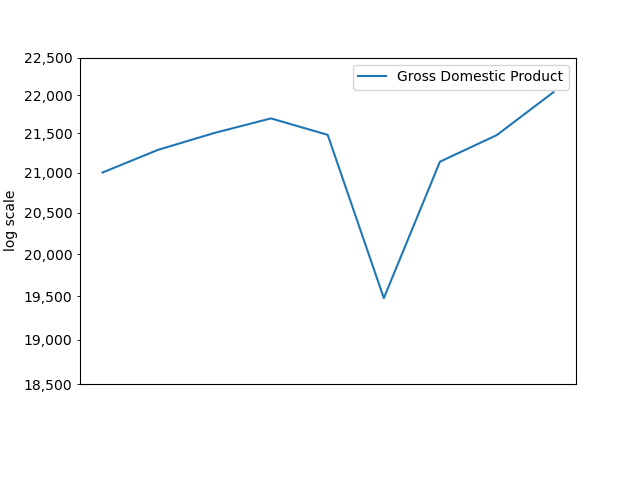
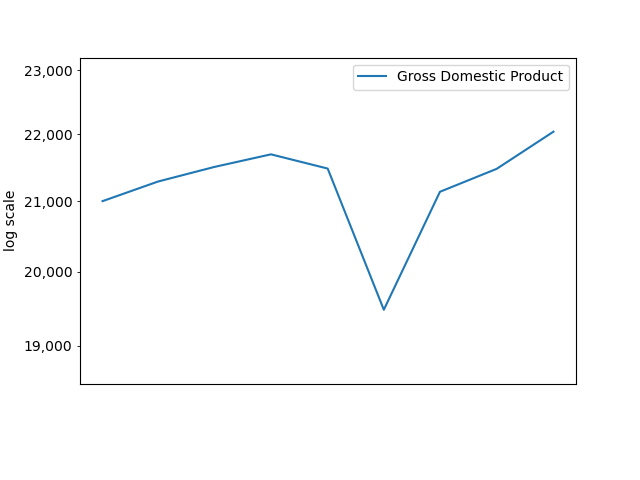
Somewhat less successful than my disastrous attempts to customize the dates: my attempt to customize the log axis.
Experiment with log scale
from matplotlib.ticker import LogLocator, FuncFormatter
f, ax = plt.subplots()
df.plot(ax=ax, x='Date', x_compat=True)
ax.set_yscale('log')
ax.yaxis.set_major_locator(LogLocator(base=10.0, numticks=2))  # <- not helpful
plt.ticklabel_format(axis='y', style='plain')  # <- doesn't do a thing
ax.get_yaxis().set_major_formatter(FuncFormatter(lambda x, pos: format(int(x), ',')))
#ax.yaxis.set_major_formatter(FuncFormatter(lambda x, pos: format(int(x), ',')))
# what's the difference between ax.get_yaxis().set_etc.  and ax.yaxis.set_etc. ?
ax.yaxis.set_label_text('log scale')
plt.savefig("log-1.png")
plt.show()