I would like to place the ylabel in a matplotlib plot horizontally and with the same distance to the y-axis as the y-tick labels. When using axis coordinate 0.0 and "right" horizontal alignment, they are (almost) snug with the axis:
import matplotlib.pyplot as plt
import numpy as np


x = np.array([0.0, 1.0])
y = x
plt.plot(x, y)

ax = plt.gca()
ylabel = plt.ylabel("xxxx\nxxx", horizontalalignment="right", multialignment="right")
plt.gca().yaxis.set_label_coords(0.0, 0.5)
ylabel.set_rotation(0)

plt.show()
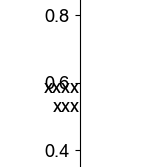
I want the xs to have the same distance from the axis as the 0.6 in the plot.
Any hints?
Offset them by the tick length?
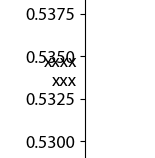
Close, but no cigar. A little something appears to be missing:
import matplotlib.pyplot as plt
import numpy as np

# dummy plot
x = np.array([0.0, 1.0])
y = x
plt.plot(x, y)

ax = plt.gca()

# get pad in points
yticks = ax.yaxis.get_major_ticks()
pad_pt = yticks[-1].get_pad()
print("pad [pt]:", pad_pt)


# transform origin to dpi space, subtract pad_pt, transform back to axes coords
fig = plt.gcf()
trans = ax.transAxes + fig.dpi_scale_trans.inverted()
ax_coords = [0, 0]
dpi_coords = trans.transform(ax_coords)
dpi_coords[0] -= pad_pt / 72
ax_coords = (trans.inverted()).transform(dpi_coords)
pos_x = ax_coords[0]
print(pos_x)

ylabel = plt.ylabel("xxxx\nxxx", horizontalalignment="right", multialignment="right")
plt.gca().yaxis.set_label_coords(pos_x, 0.5)
ylabel.set_rotation(0)

plt.show()
I think you also need to account for Tick.get_tick_padding()
I already do that via get_pad()
Apparently, there’s always some little space that’s unaccounted for. I’ve filed a bug at pad=0 leaves space between label and tick · Issue #20677 · matplotlib/matplotlib · GitHub to address this.