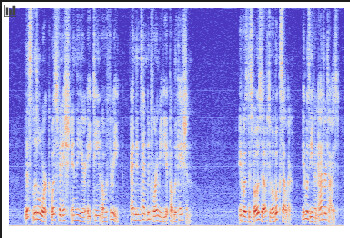
I want to use the audio spectrogram plots for machine learning and I am using librosa to get the plots.
However, when I get the plots, I am getting these white patches that I want to get rid of. I have tried various things like these but nothing seems to work. when I try to get the shape of the plot, I get the size of the plot only but when I get the array, it gives the array with the white patches. Is there a way I get the plot only so that I can use it in my machine learning task? Please let me know.
Here is the code:
x = librosa.load('LibriSpeech/train-clean-100/19/198/19-198-0001.flac', sr=16000)
X = librosa.stft(x[0])
#converting into energy levels(dB)
Xdb = librosa.amplitude_to_db(abs(X))
fig, ax = plt.subplots()
plt.box(on=None)
img = librosa.display.specshow(Xdb)
ax.axis('off')
fig.patch.set_visible(False)
I get the shape of the plot through img.figure.get_size_inches()*img.figure.get_dpi() and the array as img.get_array() but they don’t match.
Here’s the link to the audio file
Matplotlib is a plotting library, not an image manipulation library, so if you are plotting an image on a plot the image is resampled onto the axes with the number of pixels in the output set by the size of the axes in inches and the dpi. So you could have a 2x2 image that is sampled to a 5inch x 5 inch 100 dpi axes would be 500 x 500 pixels on the figure. On the same axes a 3000x3000 array would also be downsampled to 500x500 pixels.
To verify: You are using librosa to plot (via Maplotlib) the spectra of an audio file and you are then using that output to feed into a ML algorithm? The “white patches” are the padding around the boarder?
I have some concerns (If you can get the spectra from librosa, why not feed that directly rather than the RGBA values of plot of the spectra? If you are already at an RGBA image, does the border actually hurt the machine learning?), but I think what you want is
fig = plt.figure()
ax = fig.add_axes([0, 0, 1, 1])
which will make the Axes cover the full area of the Figure.
You probably will also want
import matplotlib.pyplot as plt
import numpy as np
fig, ax = plt.subplots()
...
fig.canvas.draw()
pixels = np.asarray(fig.canvas.buffer_rgba()) / 255
I also suggest you read Usage Guide — Matplotlib 3.4.2 documentation to clarify the parts of a Matplotlib figure.
[Edited to fix bug in example code!]
The rect is [left, bottom, width, height], so this should be:
ax = fig.add_axes([0, 0, 1, 1])
 Thanks @QuLogic . I’ve edited my post to correct that.