Im experiencing unexpected behavior with contourf.
Im trying to plot float values of '0.0', while also using the following levels array with contourf():
Lv=(0,1,3,5,6,7,8,9,10,12,14,16,18,20,25,30,35,40,50,75)
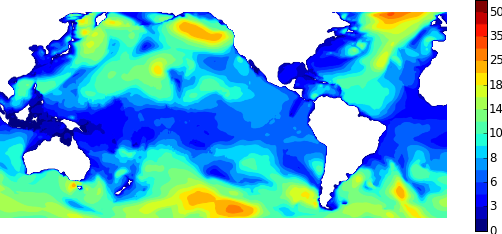
I've attached a sample image of the output.
the areas in white are contours where the plot values are exactly '0.0'.
I am not using the "extend='min|both'" in my contourf() function call.
If I use the "extend='min|both'" option, it will plot the '0.0' plot values using the color of the 1st-2nd level (blue). However, for my application, I DO NOT want to use the 'extend' option; I want my contour & colorbar levels to start at 0.
So, in theory,the '0.0' float values *should* be considered to be at the '0->1' range within my levels array, correct?
Im not sure how to create an example that can reproduce my data with '0.0' float values.
this is more/less the basis of the code I used to create the attached plot image:
# assume Z is my dataset
Z=create_my_data()
# setup basemap instance
# I call contourf from the basemap instance
# but the problem still exists even when
# contourf is called from pyplot instance
m=basemap(...)
...
print "Z: ",Z
# this prints the following
# this is the best I can do to demonstrate what my data in 'Z' looks like
···
#
# Z: [[11.9459991455 11.9789991379 12.0119991302 ..., 8.51399993896
# 8.05200004578 7.55699968338]
# [12.375 12.4079999924 12.4409999847 ..., 9.00899982452 8.57999992371
# 8.08500003815]
# [12.8039999008 12.8369998932 12.8699998856 ..., 9.43799972534
# 9.07499980927 8.64599990845]
# ...,
# [0.0 0.0 0.0 ..., 4.52099990845 5.2469997406 5.90700006485]
# [0.0 0.0 0.0 ..., 6.13800001144 6.33599996567 6.73199987411]
# [0.0 0.0 0.0 ..., 4.98299980164 5.64299964905 6.26999998093]]
# my plotting code
Lv=(0,1,3,5,6,7,8,9,10,12,14,16,18,20,25,30,35,40,50,75)
norm = mpl.colors.BoundaryNorm(Lv,256)
cs = m.contourf(X,Y,Z,Lv,norm=norm,cmap=cm.jet)
plt.colorbar(cs)
plt.show()
I believe that matplotlib is having issues with comparing the "zero"- value level & '0.0' array values in my plot; it seems like its considering the '0.0' values to be 'less than zero' and thus not plotting them within the 'zero-through-one' level of my levels array. It seems as though its plotting these '0.0' values using the color assigned to the cmap's "set_under" property (anything below the 1st layer gets plotted in white or the 'set_under' color). is this correct?
Ive tried setting the first value in my levels array to '0.0' instead of just '0', but the results were the same.
Is this a bug; the fact that the '0.0' are not being associated with the '0' level?
Please help,
P.Romero
_________________________________________________________________
Windows Live™: Life without walls.
http://windowslive.com/explore?ocid=TXT_TAGLM_WL_allup_1a_explore_032009