Good Day!
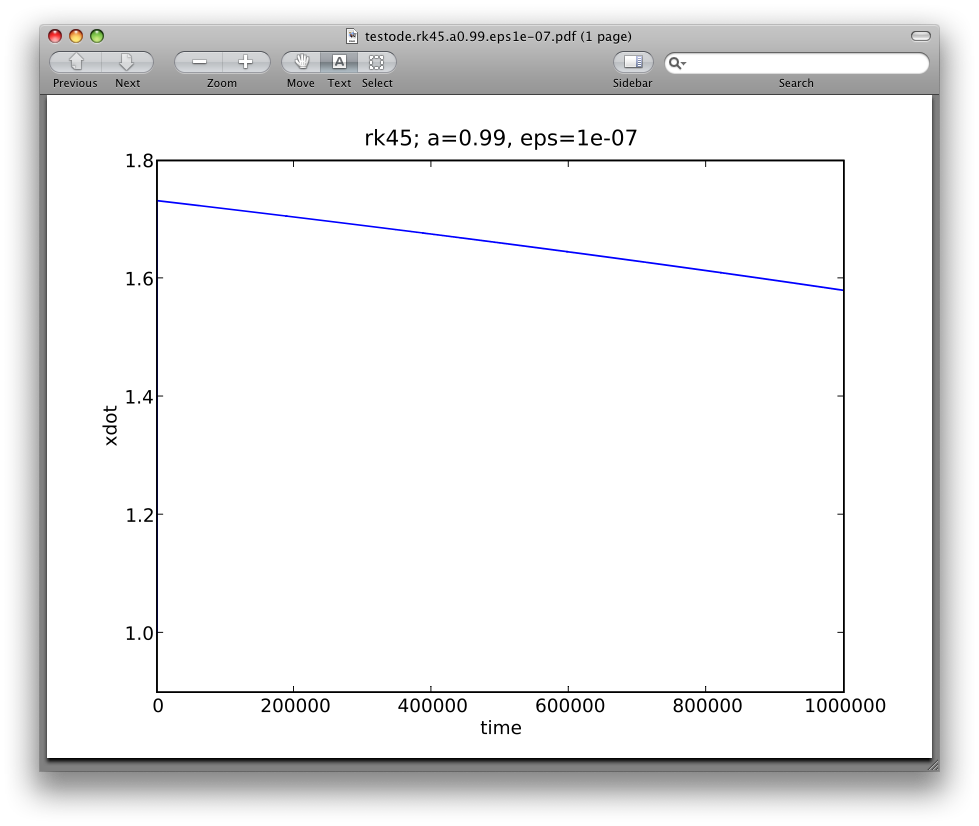
In the course of testing two ode solvers (stiff and non-stiff) I noticed
that the figures that were saved (either eps or pdf) were fuzzy. The figures
produced by the command pylab.plot(xdata, ydata) followed by pylab.show()
were essentially smooth. When I zoomed in all lines were straight and I
could distinguish where the ode solver was making steps. But the saved
figures are completely different. Sure, the curve follows the same
trajectory as the original plot it was produced from, but they line itself
is fuzzy. I've attached a sample:
http://www.nabble.com/file/p20970084/testode.rk45.a0.99.eps1e-07.pdf
testode.rk45.a0.99.eps1e-07.pdf . This comes from a completely deterministic
ode. But is looks like I've added a tiny amount of noise.
On a technical note, I'm running Ubuntu 8.04, python2.5.1, matplotlib0.91.2
(with GTKAgg backend).
(Hopefully I didn't miss a similar question--and solution--elsewhere in the
forum.)
Thanks for your help,
-Jesse
···
--
View this message in context: http://www.nabble.com/Fuzzy-plots-of-ode-solutions-tp20970084p20970084.html
Sent from the matplotlib - users mailing list archive at Nabble.com.
My guess is that you may be seeing the antialiasing of your pdf
renderer. matplotlib has a pretty good antialiasing renderer for the
screen display (antigrain) but your mileage may vary for your pdf
renderer. Since pdf is a vector output, we have no control over the
renderering. What pdf viewer are you using? The best way for us to
see what you are seeing is to take a PNG screenshot of your PDF file
displayed in your viewer and then post the PNG. Ie, here is what I am
seeing in the Preview app: the fuzziness is from the antialiasing, but
I am used to seeing this.
···
On Thu, Dec 11, 2008 at 11:16 PM, mtcoder <[email protected]...> wrote:
http://www.nabble.com/file/p20970084/testode.rk45.a0.99.eps1e-07.pdf
testode.rk45.a0.99.eps1e-07.pdf . This comes from a completely deterministic
ode. But is looks like I've added a tiny amount of noise.
On a technical note, I'm running Ubuntu 8.04, python2.5.1, matplotlib0.91.2
(with GTKAgg backend).
(Hopefully I didn't miss a similar question--and solution--elsewhere in the
forum.)
One more thought -- you should be able to turn off the antialiased
property, eg with
plot(x, y, antialiased=False)
Unfortunately, I poked into our backend_pdf and it appears this
property is ignored. Jouni: is there a way to turn off antialiasing
in PDF, and could we add support for this in the backend?
Thanks,
JDH
···
On Sat, Dec 13, 2008 at 9:38 AM, John Hunter <[email protected]...> wrote:
My guess is that you may be seeing the antialiasing of your pdf
renderer. matplotlib has a pretty good antialiasing renderer for the
screen display (antigrain) but your mileage may vary for your pdf
renderer. Since pdf is a vector output, we have no control over the
renderering. What pdf viewer are you using? The best way for us to
see what you are seeing is to take a PNG screenshot of your PDF file
displayed in your viewer and then post the PNG. Ie, here is what I am
seeing in the Preview app: the fuzziness is from the antialiasing, but
I am used to seeing this.
There's something funny going on with line caps, maybe? It looks like the corners aren't getting capped in the same way as Agg does.
I've created screenshots of Jesse's pdf file in acrobat and evince.
Any thought, Jouni?
Cheers,
Mike
John Hunter wrote:
···
On Thu, Dec 11, 2008 at 11:16 PM, mtcoder <[email protected]...> wrote:
http://www.nabble.com/file/p20970084/testode.rk45.a0.99.eps1e-07.pdf
testode.rk45.a0.99.eps1e-07.pdf . This comes from a completely deterministic
ode. But is looks like I've added a tiny amount of noise.
On a technical note, I'm running Ubuntu 8.04, python2.5.1, matplotlib0.91.2
(with GTKAgg backend).
(Hopefully I didn't miss a similar question--and solution--elsewhere in the
forum.)
My guess is that you may be seeing the antialiasing of your pdf
renderer. matplotlib has a pretty good antialiasing renderer for the
screen display (antigrain) but your mileage may vary for your pdf
renderer. Since pdf is a vector output, we have no control over the
renderering. What pdf viewer are you using? The best way for us to
see what you are seeing is to take a PNG screenshot of your PDF file
displayed in your viewer and then post the PNG. Ie, here is what I am
seeing in the Preview app: the fuzziness is from the antialiasing, but
I am used to seeing this.
------------------------------------------------------------------------
------------------------------------------------------------------------
------------------------------------------------------------------------------
SF.Net email is Sponsored by MIX09, March 18-20, 2009 in Las Vegas, Nevada.
The future of the web can't happen without you. Join us at MIX09 to help
pave the way to the Next Web now. Learn more and register at
http://ad.doubleclick.net/clk;208669438;13503038;i?http://2009.visitmix.com/
------------------------------------------------------------------------
_______________________________________________
Matplotlib-users mailing list
[email protected]
matplotlib-users List Signup and Options
Also -- for mtcoder:
Can you send us the script that generates your plot?
Also, if you set your backend to Cairo, and then generate the pdf, to you get the same result?
Cheers,
Mike
Michael Droettboom wrote:
···
There's something funny going on with line caps, maybe? It looks like the corners aren't getting capped in the same way as Agg does.
I've created screenshots of Jesse's pdf file in acrobat and evince.
Any thought, Jouni?
Cheers,
Mike
John Hunter wrote:
On Thu, Dec 11, 2008 at 11:16 PM, mtcoder <[email protected]...> wrote:
http://www.nabble.com/file/p20970084/testode.rk45.a0.99.eps1e-07.pdf
testode.rk45.a0.99.eps1e-07.pdf . This comes from a completely deterministic
ode. But is looks like I've added a tiny amount of noise.
On a technical note, I'm running Ubuntu 8.04, python2.5.1, matplotlib0.91.2
(with GTKAgg backend).
(Hopefully I didn't miss a similar question--and solution--elsewhere in the
forum.)
My guess is that you may be seeing the antialiasing of your pdf
renderer. matplotlib has a pretty good antialiasing renderer for the
screen display (antigrain) but your mileage may vary for your pdf
renderer. Since pdf is a vector output, we have no control over the
renderering. What pdf viewer are you using? The best way for us to
see what you are seeing is to take a PNG screenshot of your PDF file
displayed in your viewer and then post the PNG. Ie, here is what I am
seeing in the Preview app: the fuzziness is from the antialiasing, but
I am used to seeing this.
------------------------------------------------------------------------
------------------------------------------------------------------------
------------------------------------------------------------------------------
SF.Net email is Sponsored by MIX09, March 18-20, 2009 in Las Vegas, Nevada.
The future of the web can't happen without you. Join us at MIX09 to help
pave the way to the Next Web now. Learn more and register at
http://ad.doubleclick.net/clk;208669438;13503038;i?http://2009.visitmix.com/
------------------------------------------------------------------------
_______________________________________________
Matplotlib-users mailing list
[email protected]
matplotlib-users List Signup and Options
------------------------------------------------------------------------
------------------------------------------------------------------------
------------------------------------------------------------------------
------------------------------------------------------------------------------
SF.Net email is Sponsored by MIX09, March 18-20, 2009 in Las Vegas, Nevada.
The future of the web can't happen without you. Join us at MIX09 to help
pave the way to the Next Web now. Learn more and register at
http://ad.doubleclick.net/clk;208669438;13503038;i?http://2009.visitmix.com/
------------------------------------------------------------------------
_______________________________________________
Matplotlib-users mailing list
[email protected]
matplotlib-users List Signup and Options
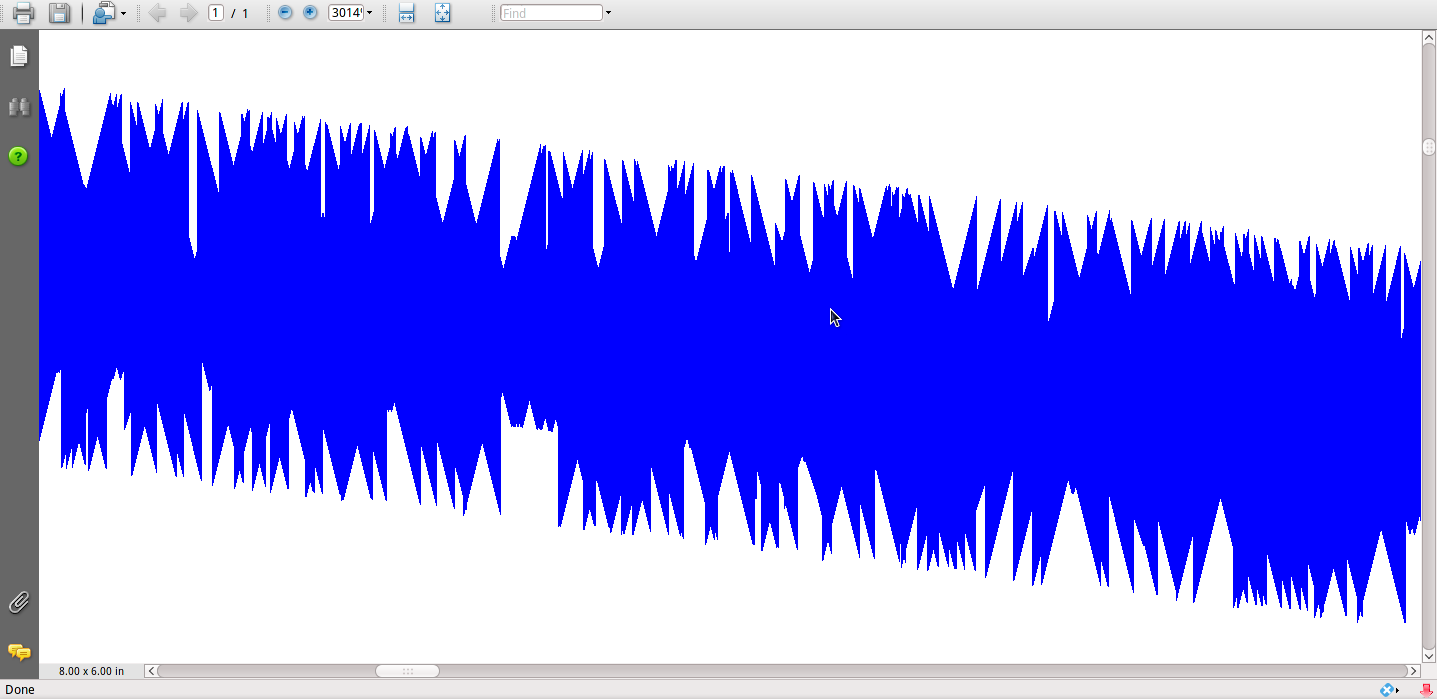
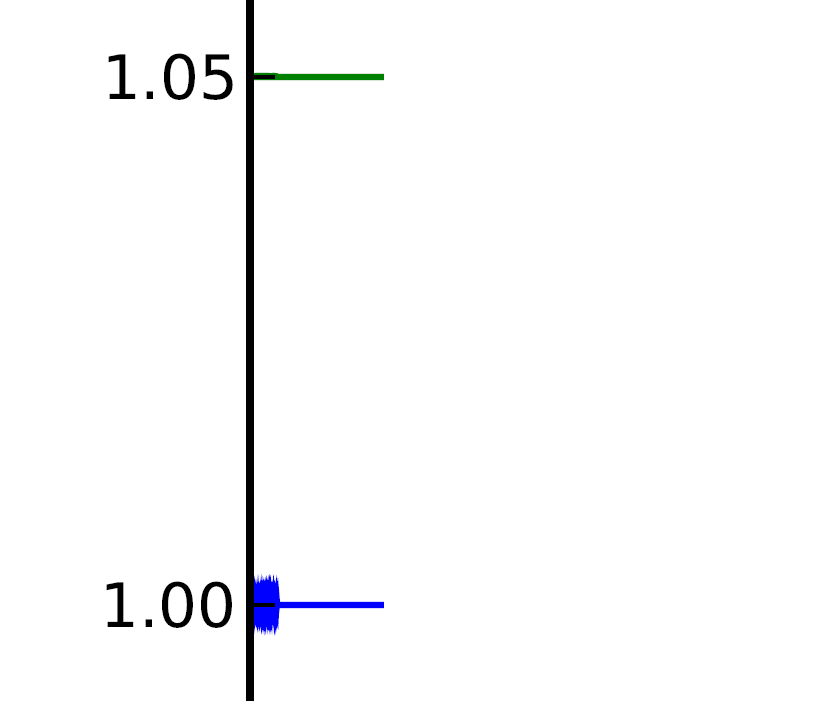
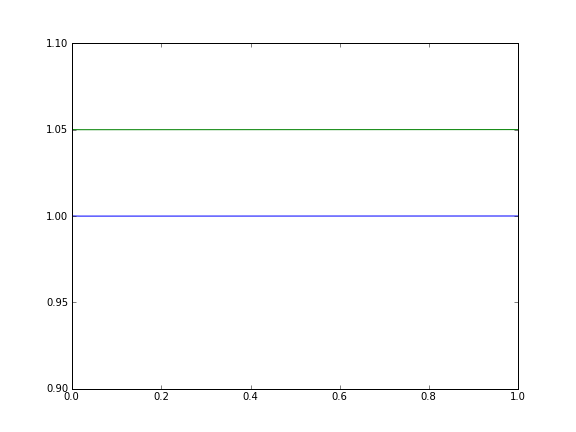
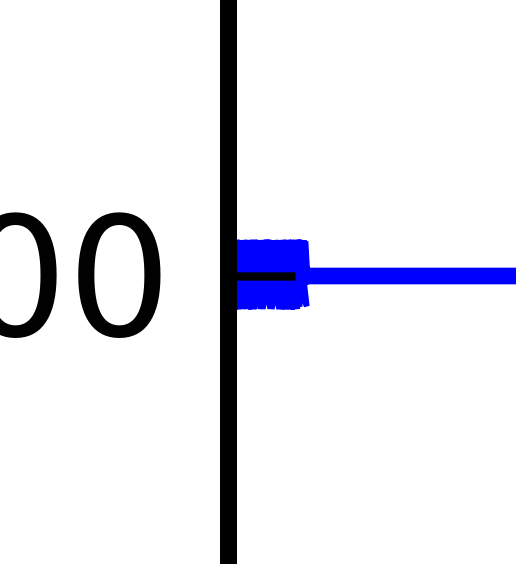
Years ago I observed a similar behaviour with gnuplot. This behaviour appears if you use line join style 'miter' and if your data is very fine spaced with small noise. Then in the figure the noise appears much larger than it actually is. Limited output precision for representing the plot data in the different backends may also both increase or attenuate the observed noise. Best solution: use round line join style. I would propose to make this the default.
I attached a script that shows this behaviour, and some images, pdf with Acrobat Reader. Agg does not show this noise, unless you render the figure with high resolution (here 1000dpi), and even then the noise is smaller. Perhaps Agg does some optimization/rounding? Difficult to tell which backend shows the correct behaviour, which might be not the preferred one.
Gregor
x = linspace(0,0.02, 1001) + random(1001)*1e-5
x[-1] = 1
y = ones_like(x)
y[:500:2] = 1 + random(250)*1e-4
clf()
plot(x,y, solid_joinstyle = 'miter')
plot(x,y+0.05, solid_joinstyle = 'round')
ylim(0.9,1.1)
savefig('testnoise.pdf')
Michael Droettboom schrieb:
testnoise.py (258 Bytes)
···
Also -- for mtcoder:
Can you send us the script that generates your plot?
Also, if you set your backend to Cairo, and then generate the pdf, to you get the same result?
Cheers,
Mike
Michael Droettboom wrote:
There's something funny going on with line caps, maybe? It looks like the corners aren't getting capped in the same way as Agg does.
I've created screenshots of Jesse's pdf file in acrobat and evince.
Any thought, Jouni?
Cheers,
Mike
John Hunter wrote:
On Thu, Dec 11, 2008 at 11:16 PM, mtcoder <[email protected]...> wrote:
http://www.nabble.com/file/p20970084/testode.rk45.a0.99.eps1e-07.pdf
testode.rk45.a0.99.eps1e-07.pdf . This comes from a completely deterministic
ode. But is looks like I've added a tiny amount of noise.
On a technical note, I'm running Ubuntu 8.04, python2.5.1, matplotlib0.91.2
(with GTKAgg backend).
(Hopefully I didn't miss a similar question--and solution--elsewhere in the
forum.)
My guess is that you may be seeing the antialiasing of your pdf
renderer. matplotlib has a pretty good antialiasing renderer for the
screen display (antigrain) but your mileage may vary for your pdf
renderer. Since pdf is a vector output, we have no control over the
renderering. What pdf viewer are you using? The best way for us to
see what you are seeing is to take a PNG screenshot of your PDF file
displayed in your viewer and then post the PNG. Ie, here is what I am
seeing in the Preview app: the fuzziness is from the antialiasing, but
I am used to seeing this.
All,
Thanks for the quick and informative responses. I've attached the code
(testode.c). It requires the GSL library. I've also attached the script I
was using to read and plot the data (odetest.py). [Note: If you do any tests
with the python script make sure to change the savefig directory in plot()
to something local. ]
http://www.nabble.com/file/p20996825/testode.zip testode.zip test code
John: I'm using evince to view pdf's (but acroread produces the same
behavior as Michael's attachments showed).
Michael: I changed the backend to Cairo and saved the figures directly to
pdf. Same results. To be clear, to do this I changed the matplotlibrc file
(backend GTKAgg -> Cairo) and then changed the filename in savefig to end
with ".pdf". I assume that is what you had in mind.
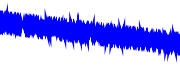
In addition, as requested here are two screenshots in png format of the
actual pylab/matplotlib output:
http://www.nabble.com/file/p20996825/odetest_pylabimg.png
odetest_pylabimg.png output
http://www.nabble.com/file/p20996825/odetest_pylabimg_zoom.png
odetest_pylabimg_zoom.png output zoomed.
Thanks for the help,
-Jesse
Michael Droettboom-3 wrote:
···
Also -- for mtcoder:
Can you send us the script that generates your plot?
Also, if you set your backend to Cairo, and then generate the pdf, to
you get the same result?
Cheers,
Mike
Michael Droettboom wrote:
There's something funny going on with line caps, maybe? It looks like
the corners aren't getting capped in the same way as Agg does.
I've created screenshots of Jesse's pdf file in acrobat and evince.
Any thought, Jouni?
Cheers,
Mike
John Hunter wrote:
On Thu, Dec 11, 2008 at 11:16 PM, mtcoder <[email protected]...> wrote:
http://www.nabble.com/file/p20970084/testode.rk45.a0.99.eps1e-07.pdf
testode.rk45.a0.99.eps1e-07.pdf . This comes from a completely
deterministic
ode. But is looks like I've added a tiny amount of noise.
On a technical note, I'm running Ubuntu 8.04, python2.5.1,
matplotlib0.91.2
(with GTKAgg backend).
(Hopefully I didn't miss a similar question--and solution--elsewhere
in the
forum.)
My guess is that you may be seeing the antialiasing of your pdf
renderer. matplotlib has a pretty good antialiasing renderer for the
screen display (antigrain) but your mileage may vary for your pdf
renderer. Since pdf is a vector output, we have no control over the
renderering. What pdf viewer are you using? The best way for us to
see what you are seeing is to take a PNG screenshot of your PDF file
displayed in your viewer and then post the PNG. Ie, here is what I am
seeing in the Preview app: the fuzziness is from the antialiasing, but
I am used to seeing this.
------------------------------------------------------------------------
------------------------------------------------------------------------
------------------------------------------------------------------------------
SF.Net email is Sponsored by MIX09, March 18-20, 2009 in Las Vegas,
Nevada.
The future of the web can't happen without you. Join us at MIX09 to
help
pave the way to the Next Web now. Learn more and register at
http://ad.doubleclick.net/clk;208669438;13503038;i?http://2009.visitmix.com/
------------------------------------------------------------------------
_______________________________________________
Matplotlib-users mailing list
[email protected]
matplotlib-users List Signup and Options
------------------------------------------------------------------------
------------------------------------------------------------------------
------------------------------------------------------------------------
------------------------------------------------------------------------------
SF.Net email is Sponsored by MIX09, March 18-20, 2009 in Las Vegas,
Nevada.
The future of the web can't happen without you. Join us at MIX09 to help
pave the way to the Next Web now. Learn more and register at
http://ad.doubleclick.net/clk;208669438;13503038;i?http://2009.visitmix.com/
------------------------------------------------------------------------
_______________________________________________
Matplotlib-users mailing list
[email protected]
matplotlib-users List Signup and Options
------------------------------------------------------------------------------
SF.Net email is Sponsored by MIX09, March 18-20, 2009 in Las Vegas,
Nevada.
The future of the web can't happen without you. Join us at MIX09 to help
pave the way to the Next Web now. Learn more and register at
http://ad.doubleclick.net/clk;208669438;13503038;i?http://2009.visitmix.com/
_______________________________________________
Matplotlib-users mailing list
[email protected]
matplotlib-users List Signup and Options
--
View this message in context: http://www.nabble.com/Fuzzy-plots-of-ode-solutions-tp20970084p20996825.html
Sent from the matplotlib - users mailing list archive at Nabble.com.
I'm having trouble getting your C code to compile (maybe a gsl version mismatch...?)
In the meantime, perhaps you could try something for me.
If you add the kwarg "solid_joinstyle='bevel'" or "solid_joinstyle='round'" to your plot command, does that improve things? If so, we could consider changing the default.
Cheers,
Mike
mtcoder wrote:
···
All,
Thanks for the quick and informative responses. I've attached the code
(testode.c). It requires the GSL library. I've also attached the script I
was using to read and plot the data (odetest.py). [Note: If you do any tests
with the python script make sure to change the savefig directory in plot()
to something local. ]
http://www.nabble.com/file/p20996825/testode.zip testode.zip test code
John: I'm using evince to view pdf's (but acroread produces the same
behavior as Michael's attachments showed).
Michael: I changed the backend to Cairo and saved the figures directly to
pdf. Same results. To be clear, to do this I changed the matplotlibrc file
(backend GTKAgg -> Cairo) and then changed the filename in savefig to end
with ".pdf". I assume that is what you had in mind.
In addition, as requested here are two screenshots in png format of the
actual pylab/matplotlib output:
http://www.nabble.com/file/p20996825/odetest_pylabimg.png
odetest_pylabimg.png output
http://www.nabble.com/file/p20996825/odetest_pylabimg_zoom.png
odetest_pylabimg_zoom.png output zoomed.
Thanks for the help,
-Jesse
Michael Droettboom-3 wrote:
Also -- for mtcoder:
Can you send us the script that generates your plot?
Also, if you set your backend to Cairo, and then generate the pdf, to you get the same result?
Cheers,
Mike
Michael Droettboom wrote:
There's something funny going on with line caps, maybe? It looks like the corners aren't getting capped in the same way as Agg does.
I've created screenshots of Jesse's pdf file in acrobat and evince.
Any thought, Jouni?
Cheers,
Mike
John Hunter wrote:
On Thu, Dec 11, 2008 at 11:16 PM, mtcoder <[email protected]...> wrote:
http://www.nabble.com/file/p20970084/testode.rk45.a0.99.eps1e-07.pdf
testode.rk45.a0.99.eps1e-07.pdf . This comes from a completely deterministic
ode. But is looks like I've added a tiny amount of noise.
On a technical note, I'm running Ubuntu 8.04, python2.5.1, matplotlib0.91.2
(with GTKAgg backend).
(Hopefully I didn't miss a similar question--and solution--elsewhere in the
forum.)
My guess is that you may be seeing the antialiasing of your pdf
renderer. matplotlib has a pretty good antialiasing renderer for the
screen display (antigrain) but your mileage may vary for your pdf
renderer. Since pdf is a vector output, we have no control over the
renderering. What pdf viewer are you using? The best way for us to
see what you are seeing is to take a PNG screenshot of your PDF file
displayed in your viewer and then post the PNG. Ie, here is what I am
seeing in the Preview app: the fuzziness is from the antialiasing, but
I am used to seeing this.
------------------------------------------------------------------------
------------------------------------------------------------------------
------------------------------------------------------------------------------
SF.Net email is Sponsored by MIX09, March 18-20, 2009 in Las Vegas, Nevada.
The future of the web can't happen without you. Join us at MIX09 to help
pave the way to the Next Web now. Learn more and register at
http://ad.doubleclick.net/clk;208669438;13503038;i?http://2009.visitmix.com/
------------------------------------------------------------------------
_______________________________________________
Matplotlib-users mailing list
[email protected]
matplotlib-users List Signup and Options
------------------------------------------------------------------------
------------------------------------------------------------------------
------------------------------------------------------------------------
------------------------------------------------------------------------------
SF.Net email is Sponsored by MIX09, March 18-20, 2009 in Las Vegas,
Nevada.
The future of the web can't happen without you. Join us at MIX09 to help
pave the way to the Next Web now. Learn more and register at
http://ad.doubleclick.net/clk;208669438;13503038;i?http://2009.visitmix.com/
------------------------------------------------------------------------
_______________________________________________
Matplotlib-users mailing list
[email protected]
matplotlib-users List Signup and Options
------------------------------------------------------------------------------
SF.Net email is Sponsored by MIX09, March 18-20, 2009 in Las Vegas,
Nevada.
The future of the web can't happen without you. Join us at MIX09 to help
pave the way to the Next Web now. Learn more and register at
http://ad.doubleclick.net/clk;208669438;13503038;i?http://2009.visitmix.com/
_______________________________________________
Matplotlib-users mailing list
[email protected]
matplotlib-users List Signup and Options
--
Michael Droettboom
Science Software Branch
Operations and Engineering Division
Space Telescope Science Institute
Operated by AURA for NASA
I compiled the code with following:
gcc -o testode.o testode.c -lm -lgsl -lgslcblas
I'm using gsl 1.10. Hope that helps. I'll try out the kwarg suggestions asap.
Thanks for the help,
-Jesse
···
On Mon, Dec 15, 2008 at 9:38 AM, Michael Droettboom <[email protected]...> wrote:
I'm having trouble getting your C code to compile (maybe a gsl version
mismatch...?)
In the meantime, perhaps you could try something for me.
If you add the kwarg "solid_joinstyle='bevel'" or "solid_joinstyle='round'"
to your plot command, does that improve things? If so, we could consider
changing the default.
Cheers,
Mike
mtcoder wrote:
All,
Thanks for the quick and informative responses. I've attached the code
(testode.c). It requires the GSL library. I've also attached the script I
was using to read and plot the data (odetest.py). [Note: If you do any
tests
with the python script make sure to change the savefig directory in plot()
to something local. ]
http://www.nabble.com/file/p20996825/testode.zip testode.zip test code
John: I'm using evince to view pdf's (but acroread produces the same
behavior as Michael's attachments showed).
Michael: I changed the backend to Cairo and saved the figures directly to
pdf. Same results. To be clear, to do this I changed the matplotlibrc file
(backend GTKAgg -> Cairo) and then changed the filename in savefig to end
with ".pdf". I assume that is what you had in mind.
In addition, as requested here are two screenshots in png format of the
actual pylab/matplotlib output:
http://www.nabble.com/file/p20996825/odetest_pylabimg.png
odetest_pylabimg.png output
http://www.nabble.com/file/p20996825/odetest_pylabimg_zoom.png
odetest_pylabimg_zoom.png output zoomed.
Thanks for the help,
-Jesse
Michael Droettboom-3 wrote:
Also -- for mtcoder:
Can you send us the script that generates your plot?
Also, if you set your backend to Cairo, and then generate the pdf, to you
get the same result?
Cheers,
Mike
Michael Droettboom wrote:
There's something funny going on with line caps, maybe? It looks like
the corners aren't getting capped in the same way as Agg does.
I've created screenshots of Jesse's pdf file in acrobat and evince.
Any thought, Jouni?
Cheers,
Mike
John Hunter wrote:
On Thu, Dec 11, 2008 at 11:16 PM, mtcoder <[email protected]...> wrote:
http://www.nabble.com/file/p20970084/testode.rk45.a0.99.eps1e-07.pdf
testode.rk45.a0.99.eps1e-07.pdf . This comes from a completely
deterministic
ode. But is looks like I've added a tiny amount of noise.
On a technical note, I'm running Ubuntu 8.04, python2.5.1,
matplotlib0.91.2
(with GTKAgg backend).
(Hopefully I didn't miss a similar question--and solution--elsewhere
in the
forum.)
My guess is that you may be seeing the antialiasing of your pdf
renderer. matplotlib has a pretty good antialiasing renderer for the
screen display (antigrain) but your mileage may vary for your pdf
renderer. Since pdf is a vector output, we have no control over the
renderering. What pdf viewer are you using? The best way for us to
see what you are seeing is to take a PNG screenshot of your PDF file
displayed in your viewer and then post the PNG. Ie, here is what I am
seeing in the Preview app: the fuzziness is from the antialiasing, but
I am used to seeing this.
------------------------------------------------------------------------
------------------------------------------------------------------------
------------------------------------------------------------------------------
SF.Net email is Sponsored by MIX09, March 18-20, 2009 in Las Vegas,
Nevada.
The future of the web can't happen without you. Join us at MIX09 to
help
pave the way to the Next Web now. Learn more and register at
http://ad.doubleclick.net/clk;208669438;13503038;i?http://2009.visitmix.com/
------------------------------------------------------------------------
_______________________________________________
Matplotlib-users mailing list
[email protected]
matplotlib-users List Signup and Options
------------------------------------------------------------------------
------------------------------------------------------------------------
------------------------------------------------------------------------
------------------------------------------------------------------------------
SF.Net email is Sponsored by MIX09, March 18-20, 2009 in Las Vegas,
Nevada.
The future of the web can't happen without you. Join us at MIX09 to
help
pave the way to the Next Web now. Learn more and register at
http://ad.doubleclick.net/clk;208669438;13503038;i?http://2009.visitmix.com/
------------------------------------------------------------------------
_______________________________________________
Matplotlib-users mailing list
[email protected]
matplotlib-users List Signup and Options
------------------------------------------------------------------------------
SF.Net email is Sponsored by MIX09, March 18-20, 2009 in Las Vegas,
Nevada.
The future of the web can't happen without you. Join us at MIX09 to help
pave the way to the Next Web now. Learn more and register at
http://ad.doubleclick.net/clk;208669438;13503038;i?http://2009.visitmix.com/
_______________________________________________
Matplotlib-users mailing list
[email protected]
matplotlib-users List Signup and Options
--
Michael Droettboom
Science Software Branch
Operations and Engineering Division
Space Telescope Science Institute
Operated by AURA for NASA
--
PhD Candidate
Department of Mathematics
Montana State University
Bozeman, MT
In the meantime, I was able to get everything working and could confirm.
Passing solid_joinstyle='bevel' does resolve the problem on both 0.91.x and 0.98.x. Additionally, path simplification (which is a new feature on 0.98.x) also resolves this problem (set rcParam path.simplify to True).
The wider question is:
a) should bevel be the default going forward?
b) maybe this deserves a FAQ entry
Mike
Jesse Berwald wrote:
···
I compiled the code with following:
gcc -o testode.o testode.c -lm -lgsl -lgslcblas
I'm using gsl 1.10. Hope that helps. I'll try out the kwarg suggestions asap.
Thanks for the help,
-Jesse
On Mon, Dec 15, 2008 at 9:38 AM, Michael Droettboom <[email protected]...> wrote:
I'm having trouble getting your C code to compile (maybe a gsl version
mismatch...?)
In the meantime, perhaps you could try something for me.
If you add the kwarg "solid_joinstyle='bevel'" or "solid_joinstyle='round'"
to your plot command, does that improve things? If so, we could consider
changing the default.
Cheers,
Mike
mtcoder wrote:
All,
Thanks for the quick and informative responses. I've attached the code
(testode.c). It requires the GSL library. I've also attached the script I
was using to read and plot the data (odetest.py). [Note: If you do any
tests
with the python script make sure to change the savefig directory in plot()
to something local. ]
http://www.nabble.com/file/p20996825/testode.zip testode.zip test code
John: I'm using evince to view pdf's (but acroread produces the same
behavior as Michael's attachments showed).
Michael: I changed the backend to Cairo and saved the figures directly to
pdf. Same results. To be clear, to do this I changed the matplotlibrc file
(backend GTKAgg -> Cairo) and then changed the filename in savefig to end
with ".pdf". I assume that is what you had in mind.
In addition, as requested here are two screenshots in png format of the
actual pylab/matplotlib output:
http://www.nabble.com/file/p20996825/odetest_pylabimg.png
odetest_pylabimg.png output
http://www.nabble.com/file/p20996825/odetest_pylabimg_zoom.png
odetest_pylabimg_zoom.png output zoomed.
Thanks for the help,
-Jesse
Michael Droettboom-3 wrote:
Also -- for mtcoder:
Can you send us the script that generates your plot?
Also, if you set your backend to Cairo, and then generate the pdf, to you
get the same result?
Cheers,
Mike
Michael Droettboom wrote:
There's something funny going on with line caps, maybe? It looks like
the corners aren't getting capped in the same way as Agg does.
I've created screenshots of Jesse's pdf file in acrobat and evince.
Any thought, Jouni?
Cheers,
Mike
John Hunter wrote:
On Thu, Dec 11, 2008 at 11:16 PM, mtcoder <[email protected]...> wrote:
http://www.nabble.com/file/p20970084/testode.rk45.a0.99.eps1e-07.pdf
testode.rk45.a0.99.eps1e-07.pdf . This comes from a completely
deterministic
ode. But is looks like I've added a tiny amount of noise.
On a technical note, I'm running Ubuntu 8.04, python2.5.1,
matplotlib0.91.2
(with GTKAgg backend).
(Hopefully I didn't miss a similar question--and solution--elsewhere
in the
forum.)
My guess is that you may be seeing the antialiasing of your pdf
renderer. matplotlib has a pretty good antialiasing renderer for the
screen display (antigrain) but your mileage may vary for your pdf
renderer. Since pdf is a vector output, we have no control over the
renderering. What pdf viewer are you using? The best way for us to
see what you are seeing is to take a PNG screenshot of your PDF file
displayed in your viewer and then post the PNG. Ie, here is what I am
seeing in the Preview app: the fuzziness is from the antialiasing, but
I am used to seeing this.
------------------------------------------------------------------------
------------------------------------------------------------------------
------------------------------------------------------------------------------
SF.Net email is Sponsored by MIX09, March 18-20, 2009 in Las Vegas,
Nevada.
The future of the web can't happen without you. Join us at MIX09 to
help
pave the way to the Next Web now. Learn more and register at
http://ad.doubleclick.net/clk;208669438;13503038;i?http://2009.visitmix.com/
------------------------------------------------------------------------
_______________________________________________
Matplotlib-users mailing list
[email protected]
matplotlib-users List Signup and Options
------------------------------------------------------------------------
------------------------------------------------------------------------
------------------------------------------------------------------------
------------------------------------------------------------------------------
SF.Net email is Sponsored by MIX09, March 18-20, 2009 in Las Vegas,
Nevada.
The future of the web can't happen without you. Join us at MIX09 to
help
pave the way to the Next Web now. Learn more and register at
http://ad.doubleclick.net/clk;208669438;13503038;i?http://2009.visitmix.com/
------------------------------------------------------------------------
_______________________________________________
Matplotlib-users mailing list
[email protected]
matplotlib-users List Signup and Options
------------------------------------------------------------------------------
SF.Net email is Sponsored by MIX09, March 18-20, 2009 in Las Vegas,
Nevada.
The future of the web can't happen without you. Join us at MIX09 to help
pave the way to the Next Web now. Learn more and register at
http://ad.doubleclick.net/clk;208669438;13503038;i?http://2009.visitmix.com/
_______________________________________________
Matplotlib-users mailing list
[email protected]
matplotlib-users List Signup and Options
--
Michael Droettboom
Science Software Branch
Operations and Engineering Division
Space Telescope Science Institute
Operated by AURA for NASA
--
Michael Droettboom
Science Software Branch
Operations and Engineering Division
Space Telescope Science Institute
Operated by AURA for NASA
Passing 'bevel' to solid_joinstyle works. Thanks for the help.
-Jesse
···
On Mon, Dec 15, 2008 at 12:03 PM, Michael Droettboom <[email protected]...> wrote:
In the meantime, I was able to get everything working and could confirm.
Passing solid_joinstyle='bevel' does resolve the problem on both 0.91.x and
0.98.x. Additionally, path simplification (which is a new feature on
0.98.x) also resolves this problem (set rcParam path.simplify to True).
The wider question is:
a) should bevel be the default going forward?
b) maybe this deserves a FAQ entry
Mike
Jesse Berwald wrote:
I compiled the code with following:
gcc -o testode.o testode.c -lm -lgsl -lgslcblas
I'm using gsl 1.10. Hope that helps. I'll try out the kwarg suggestions
asap.
Thanks for the help,
-Jesse
On Mon, Dec 15, 2008 at 9:38 AM, Michael Droettboom <[email protected]...> >> wrote:
I'm having trouble getting your C code to compile (maybe a gsl version
mismatch...?)
In the meantime, perhaps you could try something for me.
If you add the kwarg "solid_joinstyle='bevel'" or
"solid_joinstyle='round'"
to your plot command, does that improve things? If so, we could consider
changing the default.
Cheers,
Mike
mtcoder wrote:
All,
Thanks for the quick and informative responses. I've attached the code
(testode.c). It requires the GSL library. I've also attached the script
I
was using to read and plot the data (odetest.py). [Note: If you do any
tests
with the python script make sure to change the savefig directory in
plot()
to something local. ]
http://www.nabble.com/file/p20996825/testode.zip testode.zip test code
John: I'm using evince to view pdf's (but acroread produces the same
behavior as Michael's attachments showed).
Michael: I changed the backend to Cairo and saved the figures directly
to
pdf. Same results. To be clear, to do this I changed the matplotlibrc
file
(backend GTKAgg -> Cairo) and then changed the filename in savefig to
end
with ".pdf". I assume that is what you had in mind.
In addition, as requested here are two screenshots in png format of the
actual pylab/matplotlib output:
http://www.nabble.com/file/p20996825/odetest_pylabimg.png
odetest_pylabimg.png output
http://www.nabble.com/file/p20996825/odetest_pylabimg_zoom.png
odetest_pylabimg_zoom.png output zoomed.
Thanks for the help,
-Jesse
Michael Droettboom-3 wrote:
Also -- for mtcoder:
Can you send us the script that generates your plot?
Also, if you set your backend to Cairo, and then generate the pdf, to
you
get the same result?
Cheers,
Mike
Michael Droettboom wrote:
There's something funny going on with line caps, maybe? It looks like
the corners aren't getting capped in the same way as Agg does.
I've created screenshots of Jesse's pdf file in acrobat and evince.
Any thought, Jouni?
Cheers,
Mike
John Hunter wrote:
On Thu, Dec 11, 2008 at 11:16 PM, mtcoder <[email protected]...> wrote:
http://www.nabble.com/file/p20970084/testode.rk45.a0.99.eps1e-07.pdf
testode.rk45.a0.99.eps1e-07.pdf . This comes from a completely
deterministic
ode. But is looks like I've added a tiny amount of noise.
On a technical note, I'm running Ubuntu 8.04, python2.5.1,
matplotlib0.91.2
(with GTKAgg backend).
(Hopefully I didn't miss a similar question--and solution--elsewhere
in the
forum.)
My guess is that you may be seeing the antialiasing of your pdf
renderer. matplotlib has a pretty good antialiasing renderer for the
screen display (antigrain) but your mileage may vary for your pdf
renderer. Since pdf is a vector output, we have no control over the
renderering. What pdf viewer are you using? The best way for us to
see what you are seeing is to take a PNG screenshot of your PDF file
displayed in your viewer and then post the PNG. Ie, here is what I
am
seeing in the Preview app: the fuzziness is from the antialiasing,
but
I am used to seeing this.
------------------------------------------------------------------------
------------------------------------------------------------------------
------------------------------------------------------------------------------
SF.Net email is Sponsored by MIX09, March 18-20, 2009 in Las Vegas,
Nevada.
The future of the web can't happen without you. Join us at MIX09 to
help
pave the way to the Next Web now. Learn more and register at
http://ad.doubleclick.net/clk;208669438;13503038;i?http://2009.visitmix.com/
------------------------------------------------------------------------
_______________________________________________
Matplotlib-users mailing list
[email protected]
matplotlib-users List Signup and Options
------------------------------------------------------------------------
------------------------------------------------------------------------
------------------------------------------------------------------------
------------------------------------------------------------------------------
SF.Net email is Sponsored by MIX09, March 18-20, 2009 in Las Vegas,
Nevada.
The future of the web can't happen without you. Join us at MIX09 to
help
pave the way to the Next Web now. Learn more and register at
http://ad.doubleclick.net/clk;208669438;13503038;i?http://2009.visitmix.com/
------------------------------------------------------------------------
_______________________________________________
Matplotlib-users mailing list
[email protected]
matplotlib-users List Signup and Options
------------------------------------------------------------------------------
SF.Net email is Sponsored by MIX09, March 18-20, 2009 in Las Vegas,
Nevada.
The future of the web can't happen without you. Join us at MIX09 to
help
pave the way to the Next Web now. Learn more and register at
http://ad.doubleclick.net/clk;208669438;13503038;i?http://2009.visitmix.com/
_______________________________________________
Matplotlib-users mailing list
[email protected]
matplotlib-users List Signup and Options
--
Michael Droettboom
Science Software Branch
Operations and Engineering Division
Space Telescope Science Institute
Operated by AURA for NASA
--
Michael Droettboom
Science Software Branch
Operations and Engineering Division
Space Telescope Science Institute
Operated by AURA for NASA
--
PhD Candidate
Department of Mathematics
Montana State University
Bozeman, MT