I’m trying to find a way to format the datetime axis to display years as numbers and months as uppercase letters. Unfortunately, Python’s strptime function doesn’t provide uppercase month names (e.g. APR). I need to format it myself, but I haven’t been able to figure out how. Since I only want to show Apr, Jul, Oct. I used a MonthLocator in a ConciseDateFormatter. I have tried the following:
import pandas as pd
import numpy as np
import matplotlib.pyplot as plt
from matplotlib.dates import MonthLocator
from matplotlib.dates import ConciseDateFormatter
from matplotlib.ticker import FuncFormatter
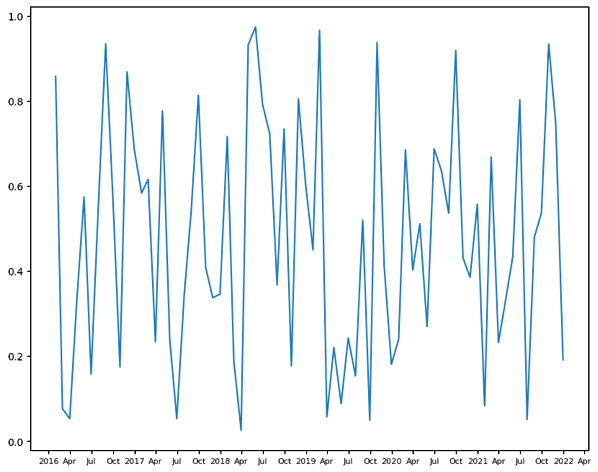
x = pd.date_range('2016-01-01', '2021-12-31', freq='M')
y = np.random.rand(len(x))
fig, ax = plt.subplots(figsize=(10, 8))
locator = MonthLocator((1, 4, 7, 10))
ax.xaxis.set_major_locator(locator)
ax.xaxis.set_major_formatter(
ConciseDateFormatter(
locator, formats=['%Y', '%b', '%d', '%H:%M', '%H:%M', '%S.%f']
)
)
ax.tick_params(axis='x', labelsize=8)
ax.plot(x, y)
But I want the axis to be
2016 - APR - JUL - OCT - 2017 - APR - JUL -OCT - 2018 -
I’ve tried a few ways, but none of them works. Once I use a user-defined FuncFormatter, it will no longer respect my ConciseDateFormatter. I’m wondering what the easiest way is for me to achieve my desired outcome. Should I simply write a formatter function that includes an if statement? If the year and month are both equal to 1, it should display the year number; otherwise, it should show the month name. If this is the case, how can I accomplish it?
Thanks in advance.