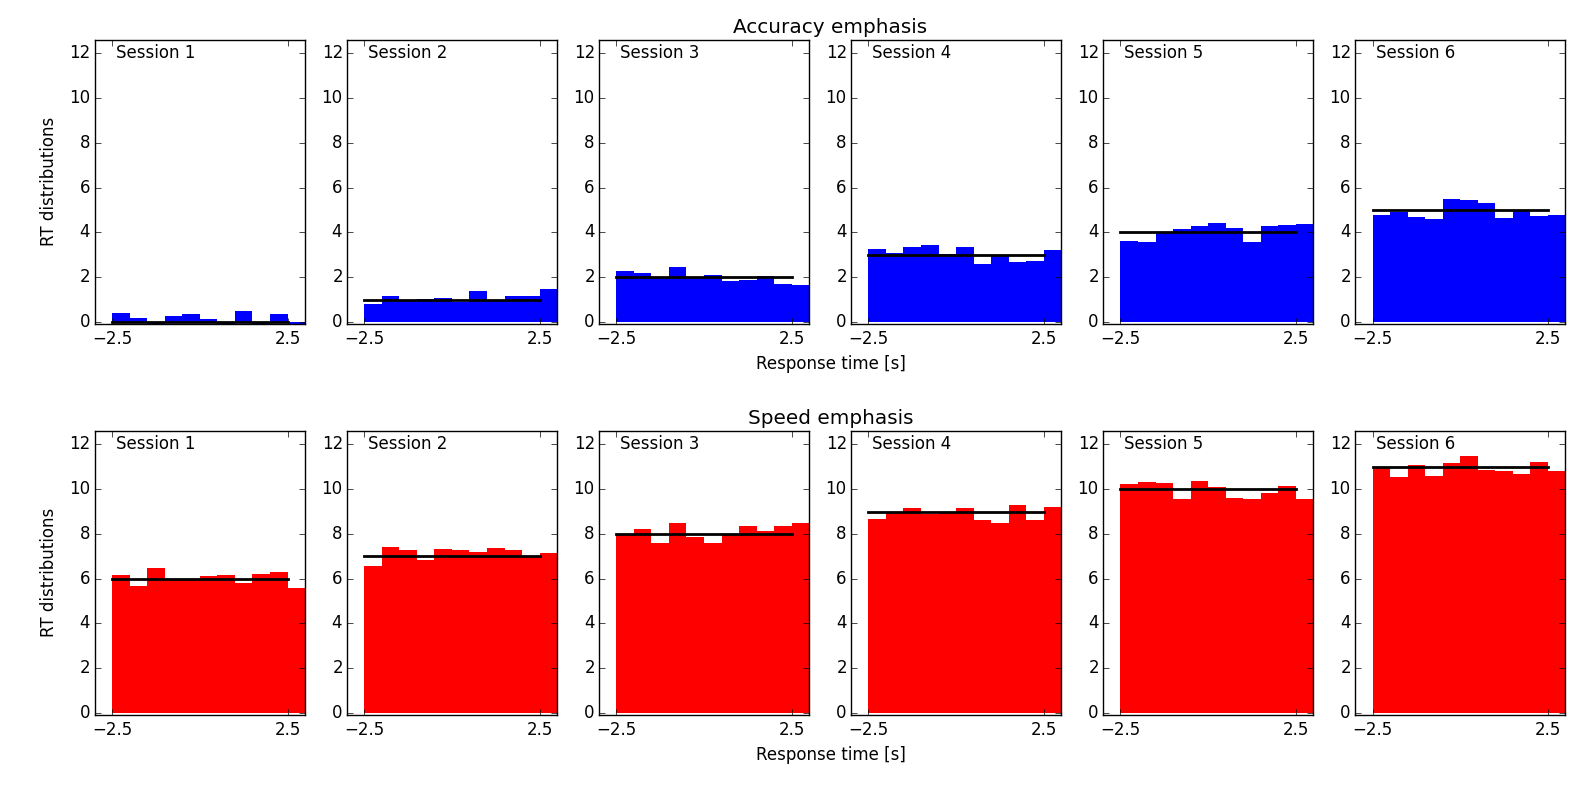
I put the data into a list of lists of numpy arrays. The following script generated a plot similar to what Juan attached:
import matplotlib.pyplot as plt
import numpy as np
def model(t, ii, jj):
“”"
Returns some numbers according to the independent variable, t, and
parameters of the model, ii and jj.
“”"
return (jj*6+ii)*np.ones_like(t)
generate data (i.e. model + some random values)
t = np.linspace(-2.5, 2.5, 11)
data = [
[model(t, ii, jj) + np.random.rand(len(t)) - .5
for ii in range(6)] # different sessions
for jj in range(2)] # accuracy/speed
do the plotting
colors = [‘b’, ‘r’]
titles = [‘Accuracy emphasis’, ‘Speed emphasis’]
fig, big_axes = plt.subplots(figsize=(16, 6), nrows=2, ncols=1, sharey=True)
for row, big_ax in enumerate(big_axes):
big_ax.set_ylabel(‘RT distributions’)
big_ax.set_xlabel(‘Response time [s]’)
big_ax.set_title(titles[row])
big_ax.tick_params(labelcolor=(1.,1.,1.,0.), top=‘off’, bottom=‘off’, left=‘off’, right=‘off’)
big_ax._frameon = False
for jj, emph_data in enumerate(data):
for ii, iidata in enumerate(emph_data):
ax = fig.add_subplot(len(data), len(emph_data), jj*len(emph_data)+ii+1)
# plot bars:
ax.bar(t, iidata,
color=colors[jj],
width=(max(t)-min(t))/(len(t)-1), # for non-overlapping bars
linewidth=0) # no outlines
# plot models:
ax.plot(t, model(t, ii, jj), ‘k’, linewidth=2)
    # annotate axes etc.
    ax.set_xticks((-2.5, 0., 2.5))
    ax.set_ylim((-.1, 12.8))
    ax.annotate('Session {}'.format(ii+1), xy=(-2.4, 11.8))
plt.tight_layout()
plt.show()
How to add the centered titles for each row is described here : http://stackoverflow.com/questions/27426668/row-titles-for-matplotlib-subplot
Jan
···
On 8 June 2015 at 03:27, Paul Hobson <pmhobson@…287…> wrote:
(apologies if the list receives this twice)
Matplotlib-users mailing list
Matplotlib-users@lists.sourceforge.net
https://lists.sourceforge.net/lists/listinfo/matplotlib-users
Juan,
It is, of course, very difficult to give any concrete advice without knowing how your data are stored.
In any case, seaborn builds on matplotlib to provide some very advanced visualization with a very concise API.
I recommend you look into the seaborn.distplot function and seaborn.FacetGrid class.
http://web.stanford.edu/~mwaskom/software/seaborn/
-Paul
On Fri, Jun 5, 2015 at 9:14 AM, Juan Wu <wujuan22@…287…> wrote:
Hi, Experts,
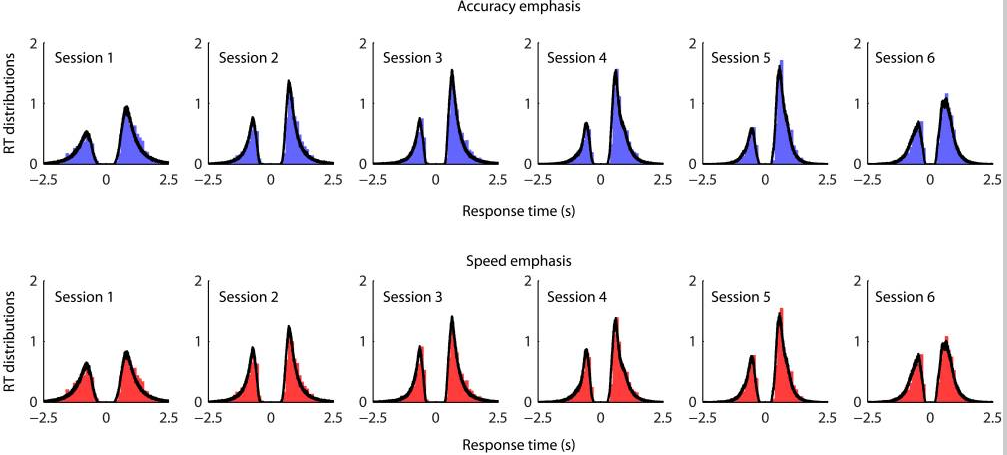
My colleagues and I have a question, how we can make a plot via python like below. According to a guy’s original paper, "Each panel shows the normalized histograms of the observed data (bar plots) and the model prediction (black lines) ".
I believe that people can make it with Matplotlib. Any code suggestion (with simple example data) would be much appreciated.
(I am more comfortable with Matlab, but now the python code is preferred).
J