Hi,
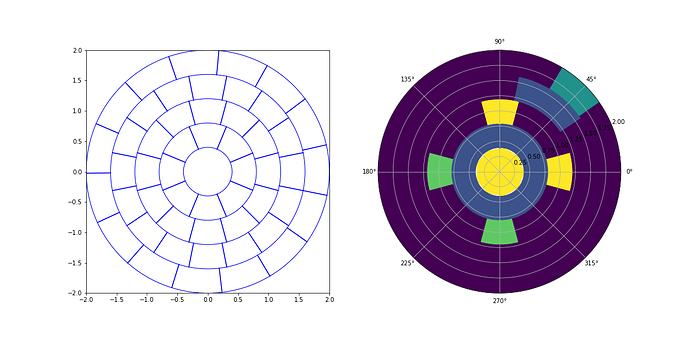
On a usual Cartesian (orthogonal) axis, I can draw the figure on the left below using plt.Circle and plt.Line2D.
To fill it with a color that corresponds to some data, as on the right, I have to switch to a polar axis. Is there a way of filling parts of disks on a Cartesian axis?
import numpy as np
from matplotlib import pyplot as plt

radii = np.array([0,0.4,0.8,1.2,1.6,2])
ncells = np.array([1,8,12,16,15])
theta_offsets = np.array([0,np.pi/8, np.pi/12,np.pi/16,np.pi/16])
data = [
    np.array([4]),
    np.array([1, 1, 1, 1, 1, 1, 1, 1]),
    np.array([0, 0, 4, 0, 0, 3, 0, 0, 3, 0, 0, 4]),
    np.array([0, 1, 1, 0, 0, 0, 0, 0, 0, 0, 0, 0, 0, 0, 0, 0]),
    np.array([0, 2, 0, 0, 0, 0, 0, 0, 0, 0, 0, 0, 0, 0, 0])
]

def draw_grid_C(ax, radii, ncells, theta_offsets, color='b'):
    for r in radii:
        ax.add_artist(plt.Circle((0,0), r, fc='none', ec=color))
    for rs, nc, ot in zip(np.column_stack((radii[:-1], radii[1:])), ncells, theta_offsets):
        if nc==1:continue
        for theta in 2*np.pi*np.arange(nc)/nc - ot:
            ax.add_artist(plt.Line2D(np.cos(theta)*rs, np.sin(theta)*rs, c=color))

def fill_grid_P(ax, radii, ncells, theta_offsets, data, cmap=plt.cm.viridis):
    dmin = min(min(d) for d in data)
    dmax = max(max(d) for d in data)
    norm = plt.Normalize(vmin=dmin, vmax=dmax)
    for i,nc in enumerate(ncells):
        dtheta = 2*np.pi / nc
        dr = radii[i+1] - radii[i]
        for j, theta in enumerate(dtheta * np.arange(nc) + theta_offsets[i]):
            ax.fill_between(
                theta + dtheta*np.linspace(0,1,10),
                radii[i], radii[i]+dr,
                color=cmap(norm(data[i][j]))
            )

fig = plt.figure(figsize=(16,8))
ax0 = fig.add_subplot(1,2,1, aspect='equal')
ax0.set_xlim(-radii[-1], radii[-1])
ax0.set_ylim(-radii[-1], radii[-1])
draw_grid_C(ax0, radii, ncells, theta_offsets)

ax1 = fig.add_subplot(1,2,2, projection='polar')
fill_grid_P(ax1, radii, ncells, theta_offsets, data)
ax1.set_ylim(0, radii[-1])

plt.savefig('polargrid2.png')
