Hello ExPyrts;
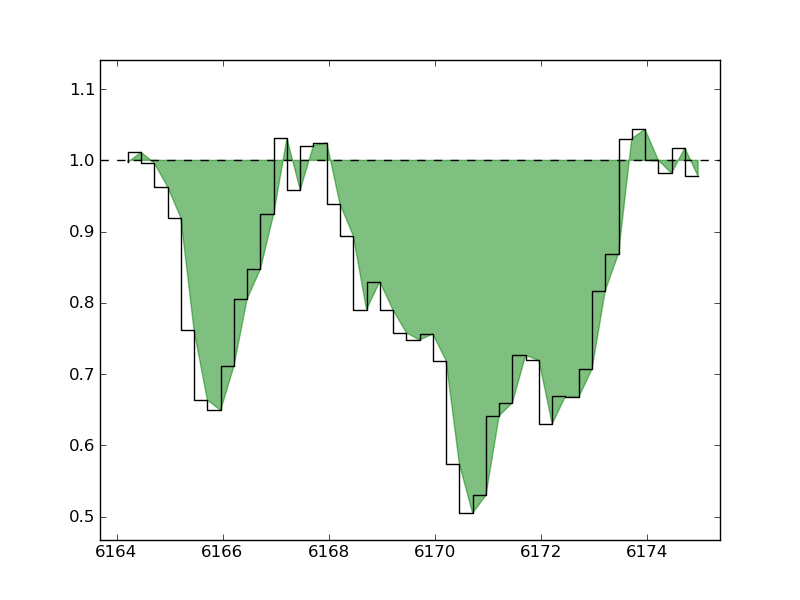
I'm trying to do a fill-between part of a spectrum and its continuum
value. I would strongly prefer the drawstyle to be steps, since each
data point represents a bin (or pixel, to be precise).
Attached is a picture illustrating my problem.
Isn't it possible to fill between my step graph and the hline?
Cheers;
Emil
From: Thøger Emil Juul Thorsen [mailto:thoeger@…845…]
Sent: Tuesday, November 09, 2010 11:10
I'm trying to do a fill-between part of a spectrum and its continuum
value. I would strongly prefer the drawstyle to be steps, since each
data point represents a bin (or pixel, to be precise).
Attached is a picture illustrating my problem.
Isn't it possible to fill between my step graph and the hline?
I haven't found that capability built-in, but you could do it if you construct
the steps yourself. In lines.py in the matplotlib source, look at the
_draw_steps_pre and similar methods of the Line2D class to see how the
coordinates of the stepped path are constructed. You could then pass those
coordinates to fill_between.