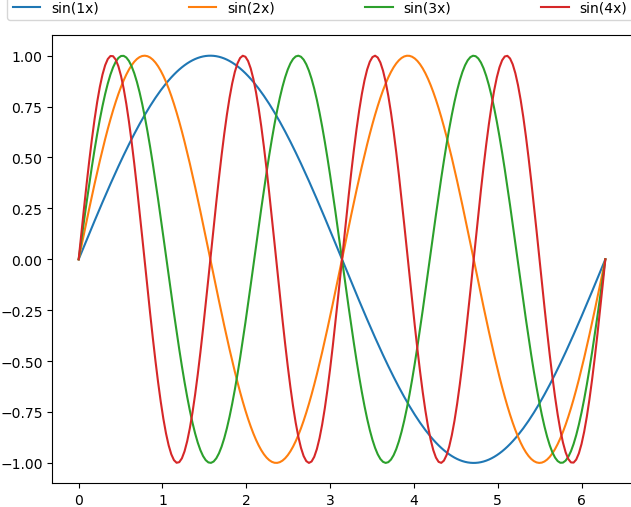
Hello, I’m trying to add a figure legend on the top of the figure that is using costrained_layout. However, matplotlib puts it inside the axis. The code:
import matplotlib.pyplot as plt
import numpy as np

fig = plt.figure(constrained_layout=True)
ax = fig.subplots()

x = np.linspace(0, 2*np.pi, 200)
for n in [1, 2, 3, 4]:
    ax.plot(x, np.sin(n*x), label=f"sin({n}x)")

fig.legend(loc="upper center", ncol=4, mode="expand")
plt.savefig("four_plots.png", pad_inches=0.0, bbox_inches="tight")
Thanks! It behaves a bit strangely when changing the width in bbox_to_anchor, i.e. pulls the two plots apart when I use for example 3 instead of 2, but I guess I’ll have to figure that out relative to my figure width.
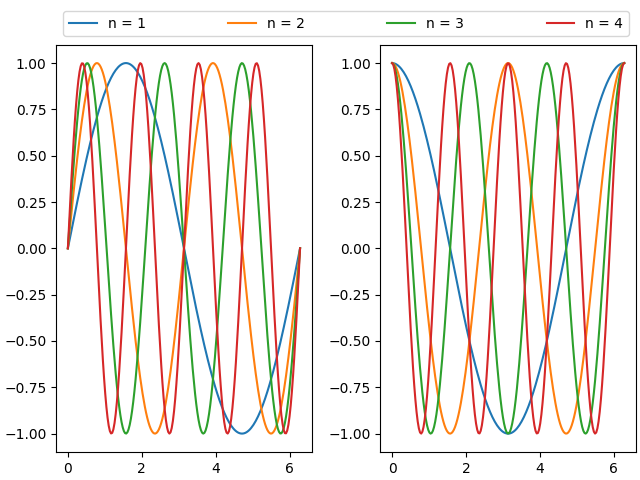
This is great, thanks a lot @jklymak! Your second solution, using fig.subplot_mosaic(), is the only one that I have found to work when displaying a legend spanning more than one axis, and using both constrained_layout and savefig. With all the other solutions I’ve tried, savefig would mess up the layout, and the axes would be collapsed in the saved figure. This happened in Matplotlib 3.6, but it did not use to happen in Matplotlib 3.5, not sure why.