Hi everyone,
I’m working on GoldenViz, a small educational project around data visualization quality, with an initial focus on Python and Matplotlib-generated figures.
The motivation came from teaching data visualization. With AI tools now able to generate plotting code quite easily, I noticed that many learners still struggle with evaluating whether a chart is actually clear, honest and useful.
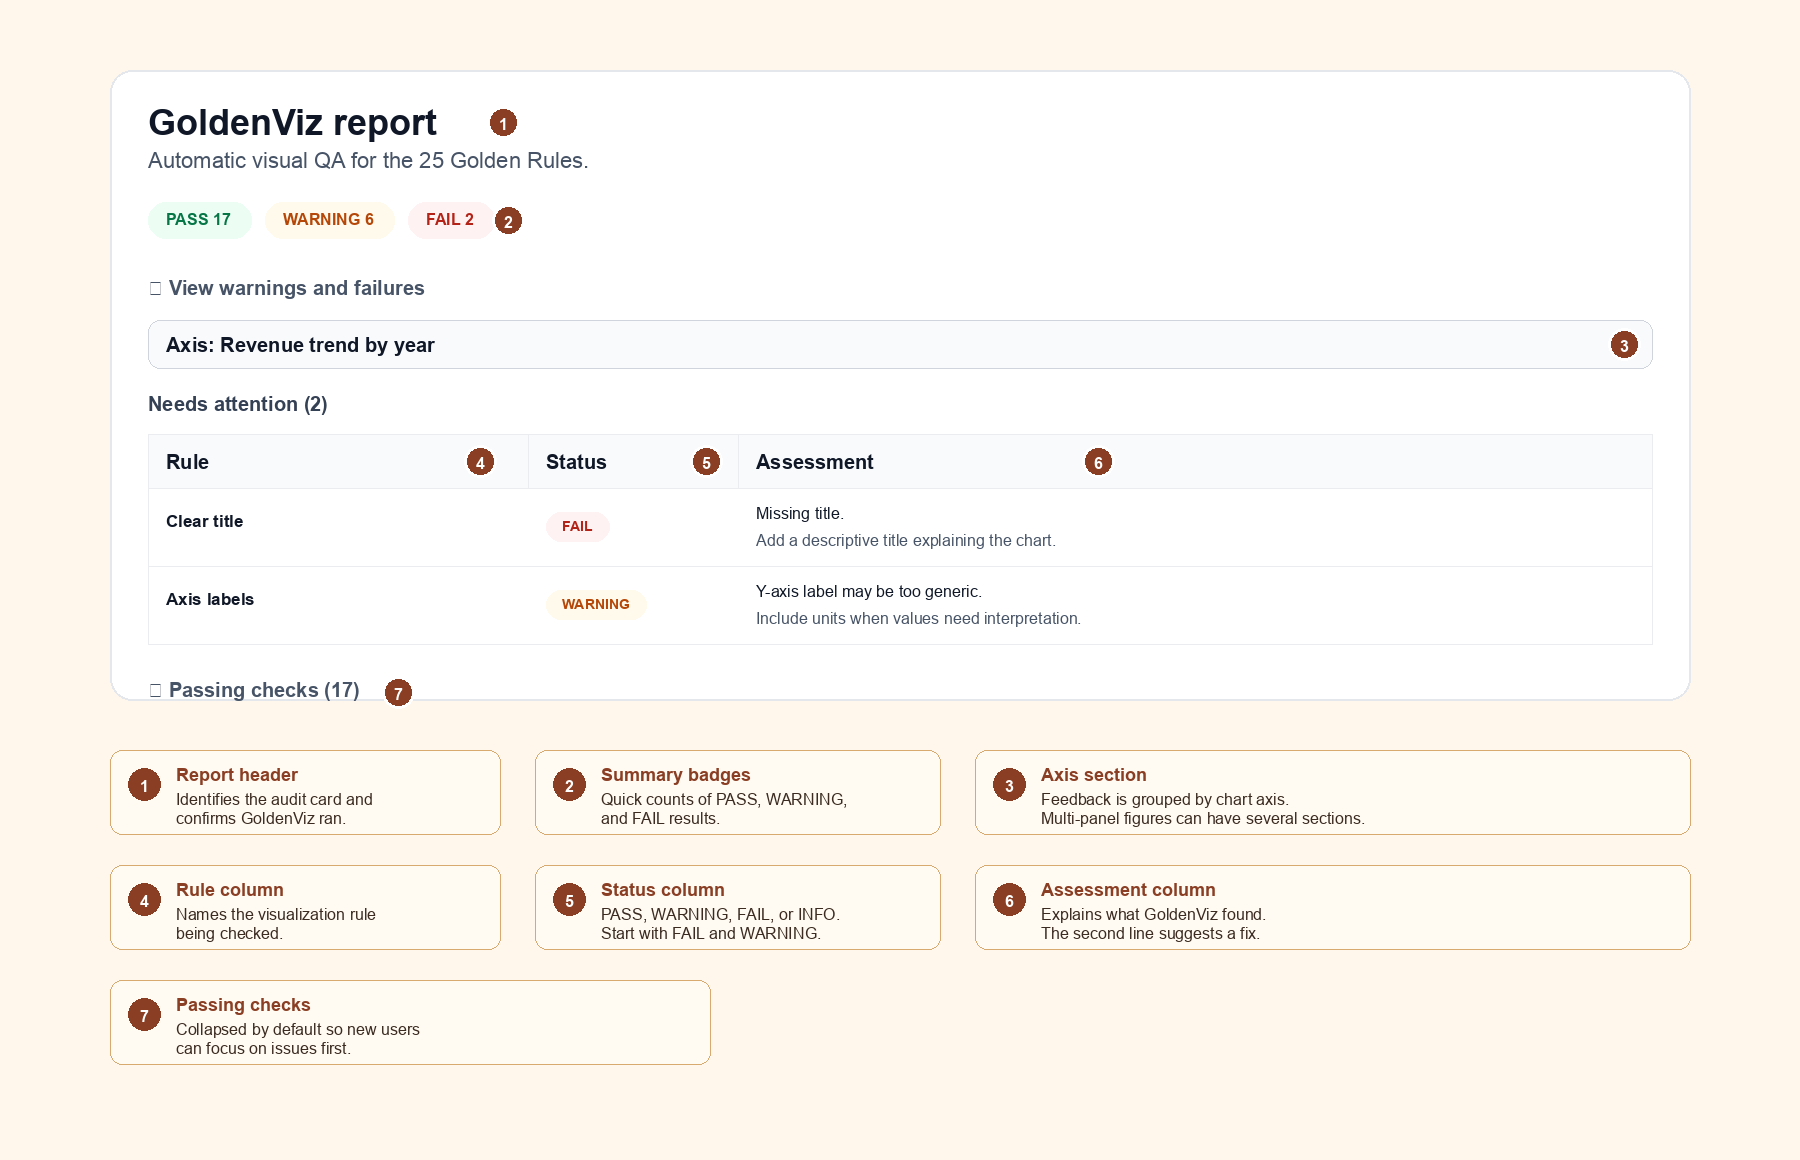
GoldenViz tries to support that by inspecting generated figures and surfacing potential issues or recommendations. The goal is not automatic grading, but feedback and discussion around visual judgment.
Examples of checks I’m exploring include:
-
missing or unclear titles, labels and axis information;
-
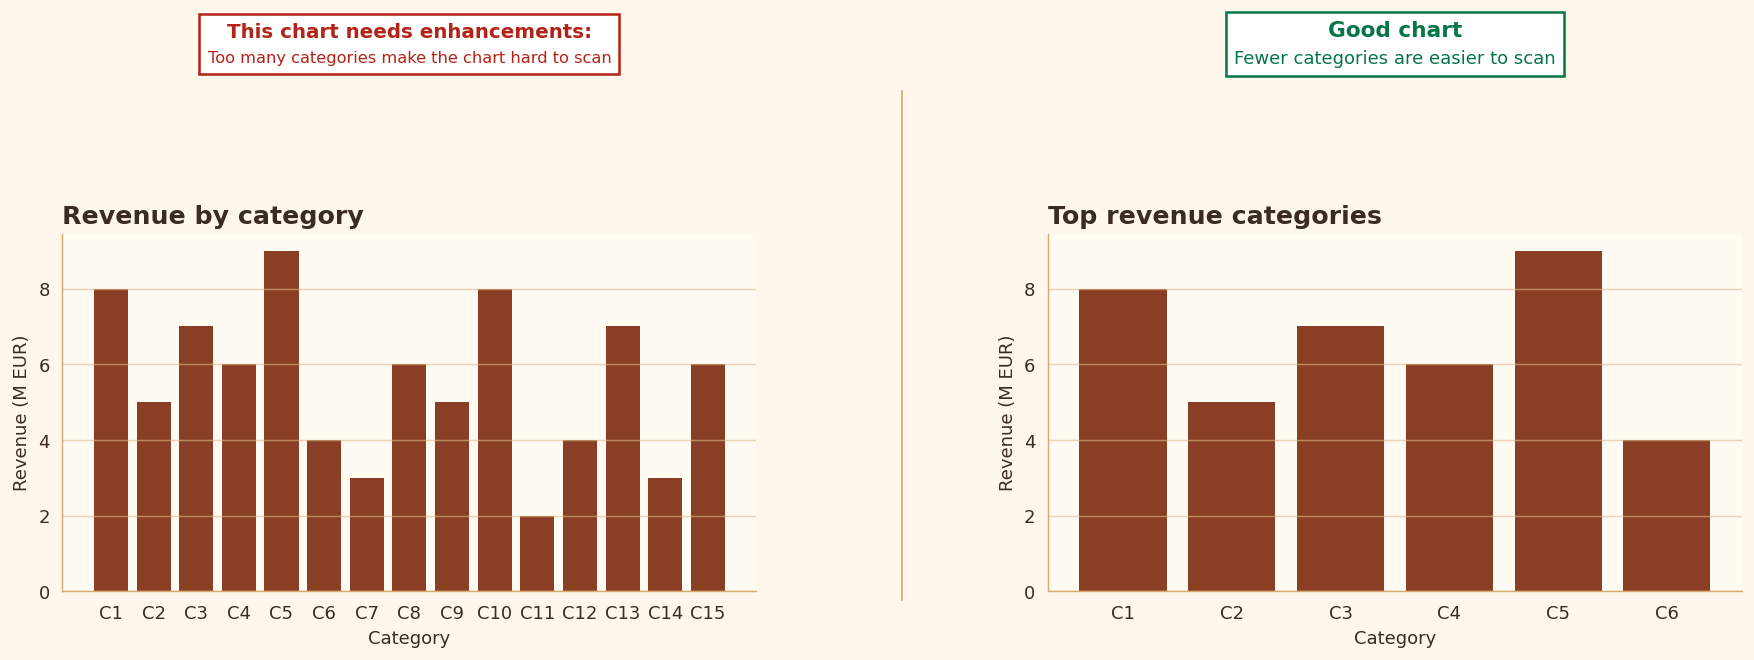
overcrowded figures;
-
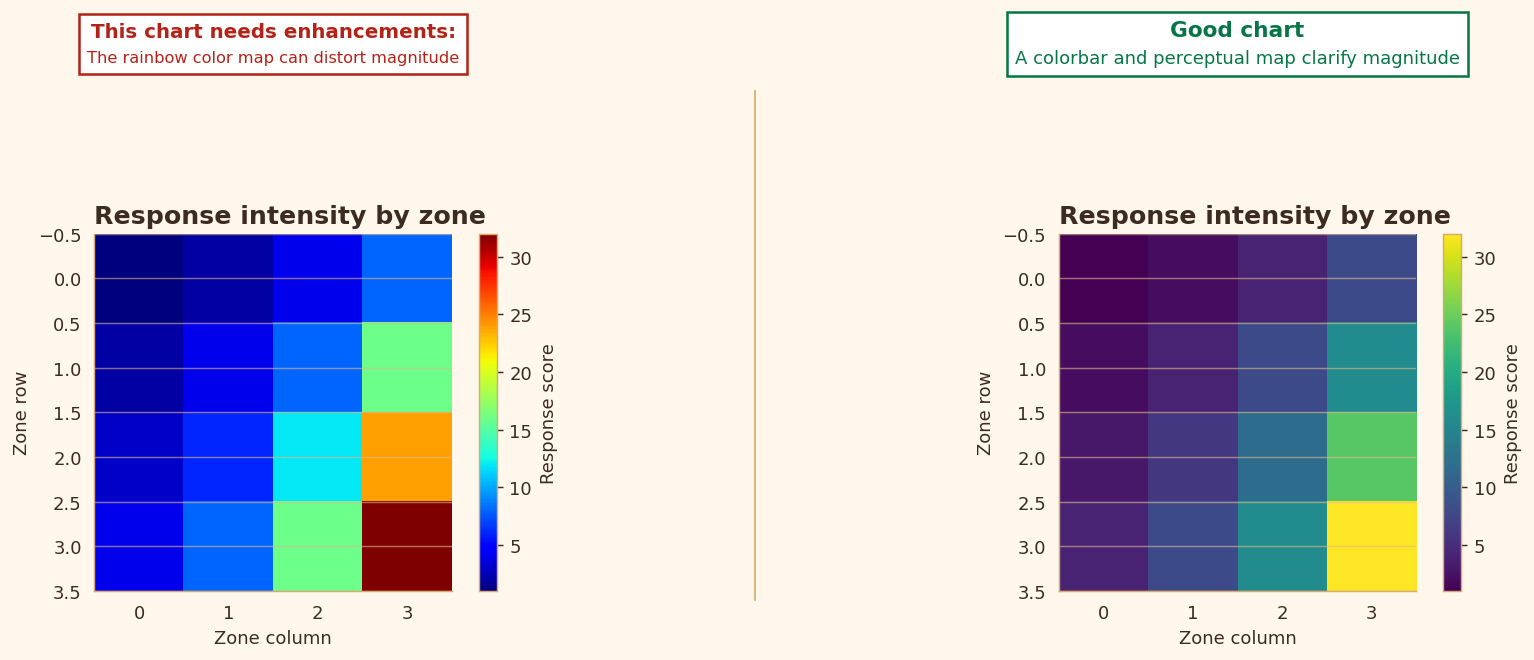
potentially misleading scales;
-
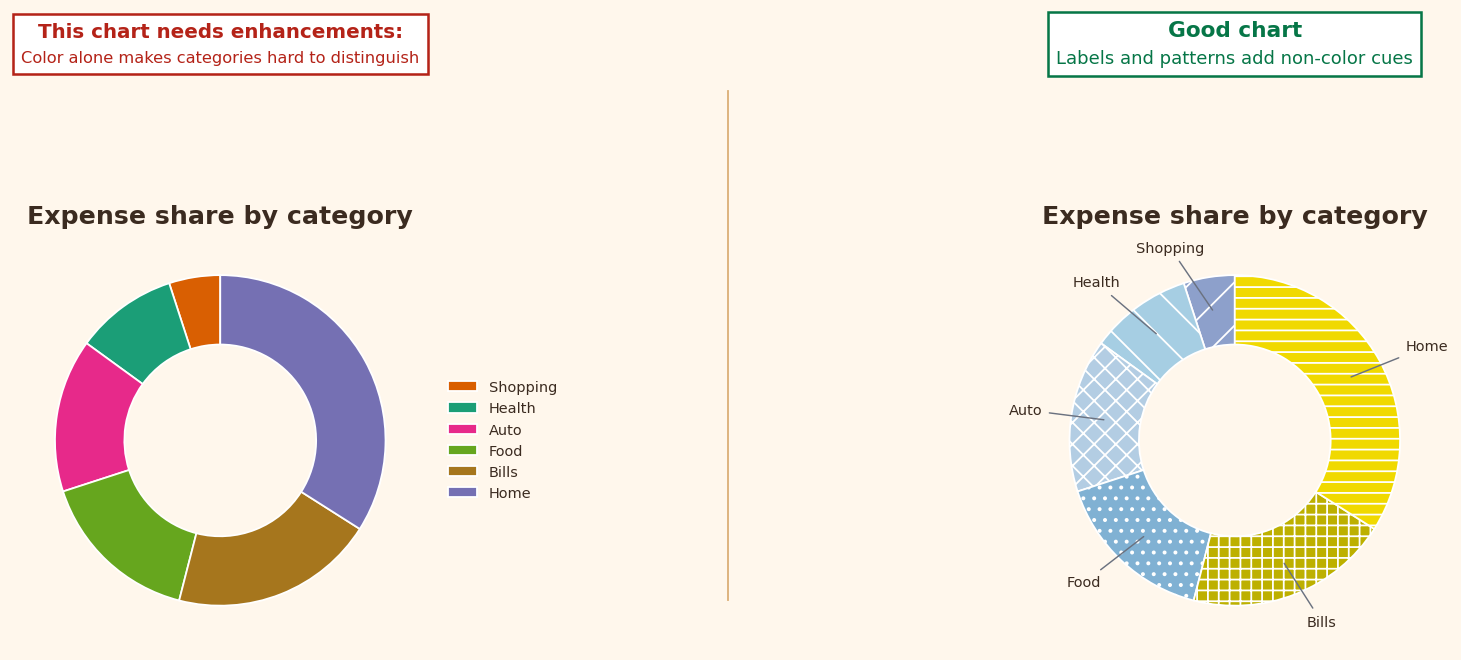
excessive or confusing use of colors;
-
chart choices that may not fit the data or communication goal.
Links:
-
Book/site: https://goldenviz.org/
-
Python docs: https://goldenviz.readthedocs.io/en/latest/
I’d really appreciate feedback from the Matplotlib community, especially on:
-
whether this kind of post-render diagnostic tool could be useful;
-
which Matplotlib figure properties are reliable enough to inspect;
-
how to avoid overclaiming or producing too many false positives;
-
whether there are existing tools, APIs or design patterns I should learn from.
Thanks in advance for any thoughts or suggestions.