Title says it all. I don’t think it’s possible to do that now.
But plots would look better if we could (especially log plots).
Thanks.
What would be the usecase for this?
See attached plot, NOT done in matplotlib, where the major gridlines are a darker shade of gray than the minor gridlines. This allows accurate reading of the data points without visually overwhelming the data and still shows how many decades are in the plot.
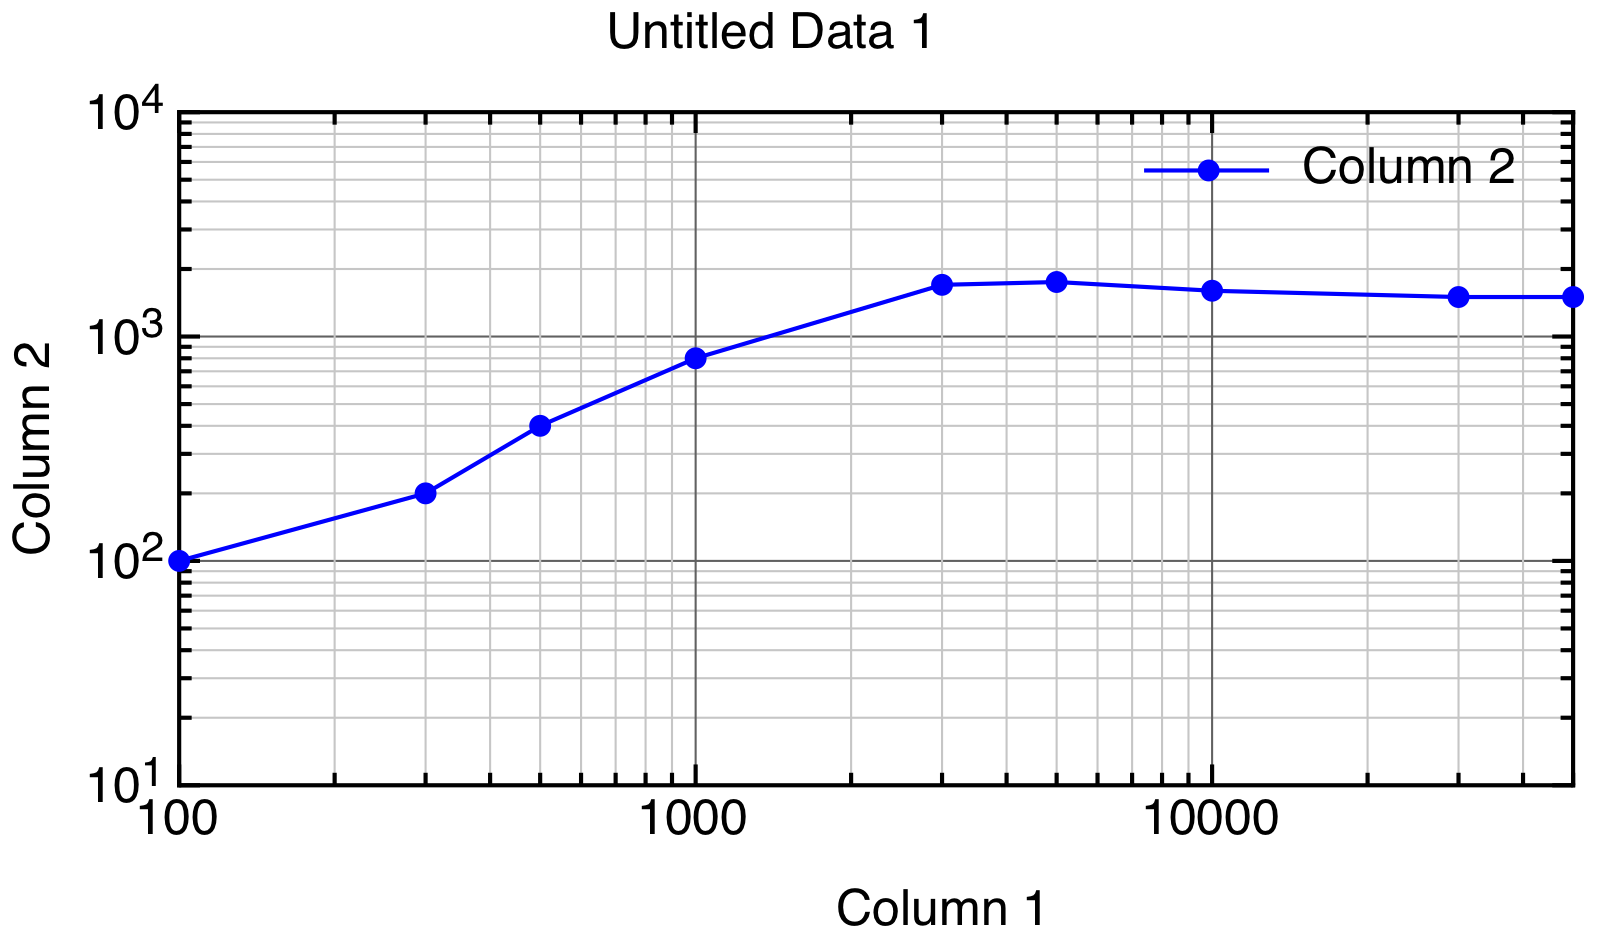
Note: I am not sure the effect show properly on this message board, because the resolution seems limited, but you get the idea. If you can, try downloading the file and look at it on a good monitor. Thanks.
I see it here and definitely looks useful - I’ve mimicked this before with vilines/hlines but grid should have that functionality. Would you be up for open an issue requesting the feature with the attached image?
Mmmhhh…sure. But where? Do you mean on Github? I looked there, but issues there seems to be more about existing code bugs. I thought this is the forum for feature requests. Please advise, thanks.
Yup on github, and actually looking through there’s an issue that’s basically asking for something really similar so you can post there: https://github.com/matplotlib/matplotlib/issues/13919
@timhoffm also provides the solution to your question:
ax.grid(which='both')
ax.tick_params(which='minor', grid_linestyle='--')
Ok, I added a Comment to the existing issue.
It’s not clear to me whether one can programmatically set linewidth, color, and alpha as well. At any rate, that method is very cumbersome.
1 Like
it’d be great if you could provide an example of what you’d like the api to look like. Like do you want to be able to call ax.grid twice?