Hi all,
Just created a a diagram as the overlay of a pcolor plot with a
labelled contour plot. I had a few issues:
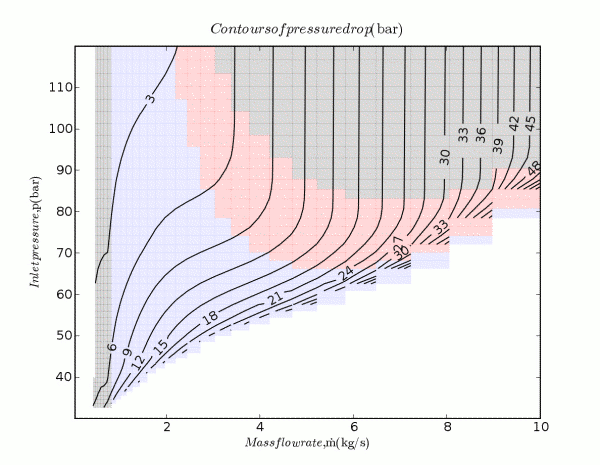
- When exporting the following image, which is a pcolor plot with
alpha=0.15 and contours on top, I get no alpha channel in the resulting
output, regard of whether I export as EPS or SVG. Is exporting with
alpha channel not supported in those formats?
- In the titles, which are generated using mathtext strings, I
can’t get spaces in the captions. I checked the manual. Here is an
example of what I typed: pylab.xlabel(r"$\it{Mass flowrate,
}\rm{\dot{m} (kg/s)}$")
- A couple of misaligned contour labels (eg ‘27’ in the below)
Any suggestions?
This is with the latest Matplotlib 0.87.3, Python 2.4, ubuntu 6.06.
Cheers
JP
···
-- John Pye
Department of Mechanical and Manufacturing Engineering
University of New South Wales, Sydney, Australia
http://pye.dyndns.org/
Just created a a diagram as the overlay of a pcolor plot with a
labelled contour plot. I had a few issues:
- When exporting the following image, which is a pcolor plot with
alpha=0.15 and contours on top, I get no alpha channel in the resulting
output, regard of whether I export as EPS or SVG. Is exporting with
alpha channel not supported in those formats?
Alpha blending is not supported in Postscript (i.e. EPS). However, SVG can support it and it does appear to be implemented for the drawing of lines in the SVG backend. Why it does not work, I can’t say.
- In the titles, which are generated using mathtext strings, I
can’t get spaces in the captions. I checked the manual. Here is an
example of what I typed: pylab.xlabel(r"\it{Mass flowrate,
}\rm{\dot{m} (kg/s)}")
You will need to escape the spaces in TeX mode, i.e. '\ ’
- A couple of misaligned contour labels (eg ‘27’ in the below)
From understanding, this issue has always been problematical. A fair amount of time was spent on trying to get it right. The developer(s) may be able to expand on this.
Any suggestions?
This is with the latest Matplotlib 0.87.3, Python 2.4, ubuntu 6.06.
Nice plot!
– Paul
···
On 6/19/06, John Pye <john.pye@…1085…> wrote:
Alpha should be supported in svg, but there is no support for alpha in
postscript. This is a problem with postscript, not mpl.
Darren
···
On Monday 19 June 2006 4:11 am, John Pye wrote:
Hi all,
Just created a a diagram as the overlay of a pcolor plot with a labelled
contour plot. I had a few issues:
When exporting the following image, which is a pcolor plot with alpha=0.15
and contours on top, I get no alpha channel in the resulting output, regard
of whether I export as EPS or SVG. Is exporting with alpha channel not
supported in those formats?