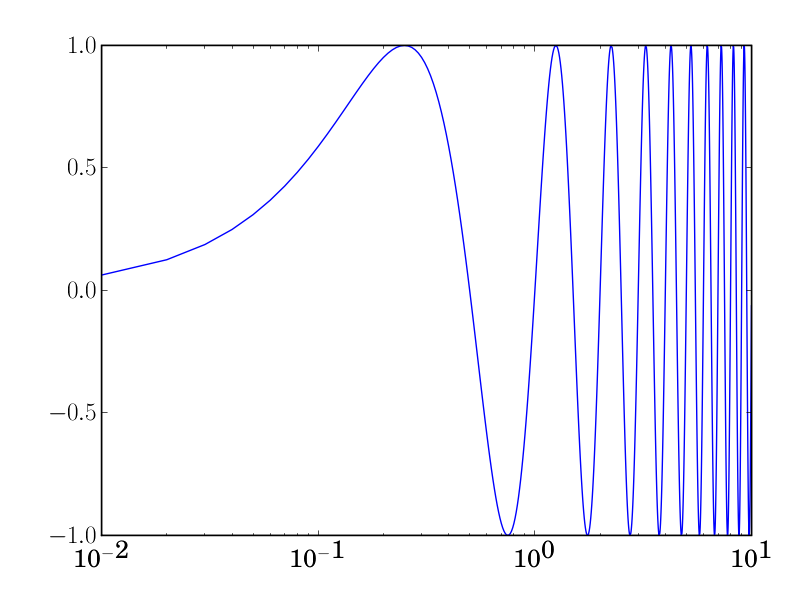
I am having a problem with the fonts for exponents on semilog plots with usetex.
The attached figure can be generated on my machine with
figure(1)
t=arange(0,10,0.01)
y=sin(2*pi*t)
semilogx(t,y)
I just upgraded to the latest svn and now the y-axis plots look
different from the x-axis.
matplotlib.__version__
Out[6]: '0.87.3'
Ryan
Hi Ryan,
I'm using the latest svn as well (2479), and I cant reproduce your problem.
Try deleting your tex.cache.
Darren
···
On Wednesday 14 June 2006 18:14, Ryan Krauss wrote:
I am having a problem with the fonts for exponents on semilog plots with
usetex.
The attached figure can be generated on my machine with
figure(1)
t=arange(0,10,0.01)
y=sin(2*pi*t)
semilogx(t,y)
I just upgraded to the latest svn and now the y-axis plots look
different from the x-axis.
matplotlib.__version__
Out[6]: '0.87.3'
Ryan
--
Darren S. Dale, Ph.D.
Cornell High Energy Synchrotron Source
Cornell University
200L Wilson Lab
Rt. 366 & Pine Tree Road
Ithaca, NY 14853
dd55@...163...
office: (607) 255-9894
fax: (607) 255-9001
There was a lot of stuff in my tex.cache, but deleting didn't solve my problem.
I may have some strange choices for my fonts and font sizes. Can you
send me a copy of your matplotlibrc file.
Ryan
···
On 6/14/06, Darren Dale <dd55@...163...> wrote:
Hi Ryan,
I'm using the latest svn as well (2479), and I cant reproduce your problem.
Try deleting your tex.cache.
Darren
On Wednesday 14 June 2006 18:14, Ryan Krauss wrote:
> I am having a problem with the fonts for exponents on semilog plots with
> usetex.
>
> The attached figure can be generated on my machine with
> figure(1)
> t=arange(0,10,0.01)
> y=sin(2*pi*t)
> semilogx(t,y)
>
> I just upgraded to the latest svn and now the y-axis plots look
> different from the x-axis.
> matplotlib.__version__
> Out[6]: '0.87.3'
>
> Ryan
--
Darren S. Dale, Ph.D.
Cornell High Energy Synchrotron Source
Cornell University
200L Wilson Lab
Rt. 366 & Pine Tree Road
Ithaca, NY 14853
dd55@...163...
office: (607) 255-9894
fax: (607) 255-9001
_______________________________________________
Matplotlib-users mailing list
Matplotlib-users@lists.sourceforge.net
matplotlib-users List Signup and Options