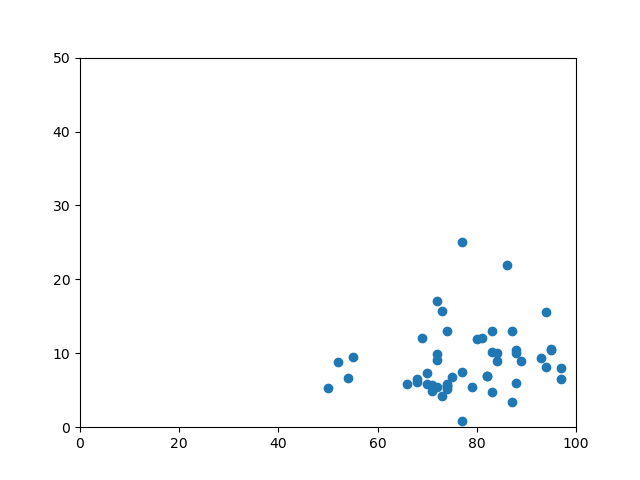
Hello! I’m brand-new to python (using 3.8.3), trying to use matplotlib and openpyxl to take data from excel and plot it in a scatter chart. When I don’t annotate, it plots fine (see Figure_1), but when I remove the hashtags from the plotting code and do attempt to annotate, I get a nasty string of errors that are way over my head. I believe it has something to do with the data types coming from excel disagreeing with my method of plotting, as if I replace my data import with manually-created lists in the program, I can get it to both plot and annotate appropriately. Here’s my code:
from openpyxl import load_workbook, Workbook
from numpy import median, mean, array
import matplotlib.pyplot as plt
workbook = load_workbook(filename=“sample.xlsx”)
sheet = workbook.active
x=
y=
z=
for i in range(1,53):
z.append(‘game title’ + str(i))
for value in sheet.iter_rows(min_row=2,min_col=5,max_col=5,values_only=True):
x.append(value)
for value in sheet.iter_rows(min_row=2,min_col=4,max_col=4,values_only=True):
y.append(value)
#for a,b,c in zip(x,y,z):
# plt.text(a,b,c)
plt.scatter(x,y)
plt.axis(ymin = 0, xmin = 0, ymax = 50, xmax = 100)
plt.show()