I have 3 different data vector with associated errors, and I’d like to plot each of them with a different color on the same ax, but randomizing the plot order of the points, so that the last data vector does not hide the two underlying ones.
So far, I have:
import numpy as np
import pandas as pd
import matplotlib.pyplot as plt

# ## generating pseudodata
x1 = np.logspace(-1, 2, 100)

X, Y = [], []
for i in range(3):
    X.append(x1*(1 + 0.2*np.random.random((100,))))
    Y.append(x1**2*(1 + 0.2*np.random.random((100,))))

fig, axarr = plt.subplots(1, 2, constrained_layout=True)

# only errorbars
ax = axarr[0]
for i, (x, y) in enumerate(zip(X, Y)):
    ax.errorbar(x, y, xerr=0.3*x, yerr=0.3*y, fmt='.', label = str(i))
ax.set_xscale('log')
ax.set_yscale('log')
ax.legend()

# only scatter plot but randomized
ax = axarr[1]

X = np.concatenate(X)
Y = np.concatenate(Y)
plot_idx = np.random.permutation(X.size)
color_cycle = plt.rcParams['axes.prop_cycle'].by_key()['color']
colors = np.concatenate([np.repeat(color_cycle[i], 100) for i in range(3)])
labels = np.concatenate([np.repeat(str(i), 100) for i in range(3)])

sc = ax.scatter(X[plot_idx], Y[plot_idx], c=colors[plot_idx], s=10)

leg_elements = [plt.Line2D([0],[0],color=c, ls="",marker=".", label=str(i))
                for i, c in enumerate(color_cycle[:3])]
ax.legend(handles=leg_elements)
ax.set_xscale('log')
ax.set_yscale('log')
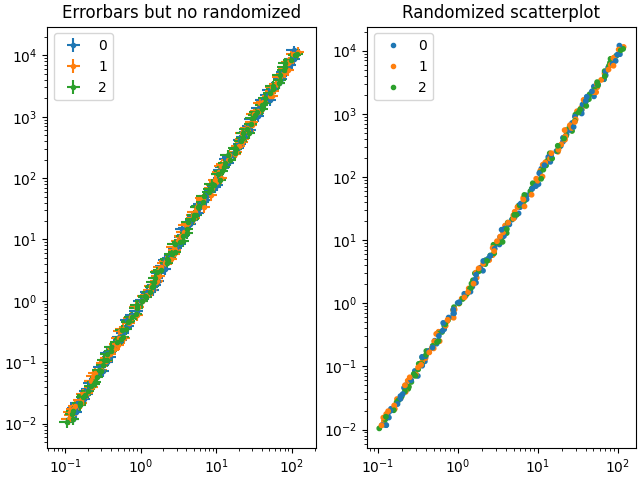
How can I mix up the two, as I can not pass a vector for the color argument of ax.errorbar ?
I was thinking about getting the points afterwards, and changing their zorder but I could not manage to do so