I am following the article of ecdf on matplotlib : ecdf example on matplotlib
However, I get this error,
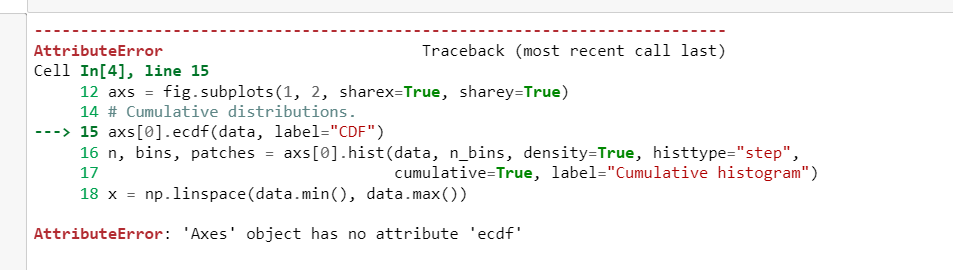
How do I resolve ?
I want to generate similar plot of this dataset :
data = [
28252.833069186046, 29340.909852853, 26497.324631925305, 28384.380029691278,
27989.383600380803, 28357.30895277504, 28799.277479101267, 27484.111853479517,
26749.73848303885, 30517.472505481055, 26893.769664273976, 26326.59848989218,
26842.119634819675, 28170.12253836586, 26724.264888619742, 27938.29643779216,
29857.679436570783, 27001.38724158459, 28415.167790501007, 27309.21714238,
28163.00367358017, 27332.872527697757, 27949.74618567751, 28120.426946642474,
25802.45852083772, 27855.4955275288, 26860.20907380904, 28416.468285310966,
28621.22975881365, 27154.207544955705, 27719.27144799498, 27407.933780459178,
28711.627701624184, 26337.93975010483, 27791.523221335523, 28456.133013578263,
28760.96136500918, 27787.820244109804, 28712.531573734217,
]
Can someone please guide me ? I am new to Matplotlib and am currently learning how to use it ?